


_tgy9FMANCY.JPG?auto=compress%2Cformat&w=40&h=40&fit=min&dpr=2)

Hardware components | ||||||
 |
| × | 1 | |||
 |
| × | 1 | |||
| × | 1 | ||||
 |
| × | 2 | |||
| × | 1 | ||||
| × | 1 | ||||
_ztBMuBhMHo.jpg?auto=compress%2Cformat&w=48&h=48&fit=fill&bg=ffffff) |
| × | 1 | |||
The Story
Often, it’s easy and socially acceptable to communicate through words. But for when it isn’t, there’s feeld. Feeld is your social sixth sense. Using GPS, thermoelectrics, and haptic feedback, this product makes otherwise implicit social cues explicit through temperature.
Video Demo
The Device
Our Presentation
The Web Application
Heatmap
The feeld web application allows users to visualize hot and cold spaces in their environments, according to the approachability levels of the feeld users in the area. Users can look around for places populated by people who share their target level of social activity. They can also investigate how approachability in a given area varies over time. Note the slider in the screenshot below, which allows the user to pick the slice of time for which the social heatmap data is shown. Users can look around for which spots tend to be social on Friday nights when they plan their own Friday nights, or they can use the map to identify when their favorite cafe tends to fill up with approachable or less approachable people. It's always fun to see how the approachable hot spots migrate over time --- how the social landscape shifts over the course of the day or week!
Personal Approachability Over Time
Feeld users can also use the web app to explore a chart of their own approachability over time. If they're feeling curious about their friends or the users they met throughout the day, they can also chart another user's approachability over time.
Personal Approachability Over Space
For the feeld user who wants to explore how his or her approachability is affected by location, the web application offers a map of a given user's approachability in space. Users can also take a look at where their friends like to talk and where they like to be left alone. The time slider again offers a convenient way to see how time and location interact to shape one's approachability.
Video Demo
Here's a quick video demo of how a feelder might use the web application:
System Architecture
The system diagram above depicts the flow of information in the feeld architecture. When User A turns the knob on his or her feeld, the feeld sends the new approachability reading to the phone; the phone forwards the data to the server, along with a timestamp, a location reading, and User A's id. The server identifies the nearest feeld user, User B, and sends User B's username and approachability back to User A's phone. The phone, in turn, displays the currently paired user (User B) and sends User B's approachability reading to the feeld. The feeld adjusts the thermoelectric to produce heat if User B is feeling approachable and cold if User B feels like being alone.
The web application pulls user approachability readings over time and space from the server, and displays a number of visualizations of the feeld data, both aggregations of all feeld user data and user-specific visualizations.
Source Code
Find all the code you'll need to make your very own feeld in our github repository: https://github.com/schasins/social-sixth-sense.
Instructions
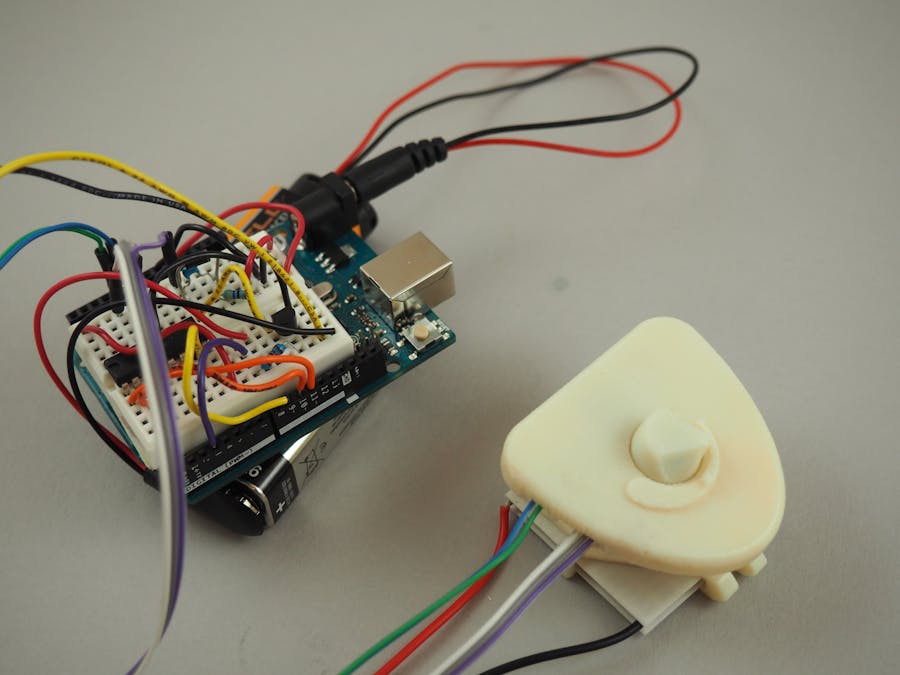
- 3D print clasp and knob.
- Solder flexible wires to potentiometer and vibration disk motor.
- Superglue vibration disk motor and potentiometer in place in the back of the clasp with their wires tucked into the holding channels. Be sure to not use too much glue on the potentiometer so that the knob does not jam up.
- Twist the potentiometer to the middle of its range and superglue the knob down on top of it with the knob pointing to the middle of its range. This will allow knob to rotate through the range of motion of the dial indicator, no more and no less.
- Wire up the arduino with the components listed below.
- Clone our github repository: https://github.com/schasins/social-sixth-sense.
- Grep for “TODO: choose server location” in the repository directory and change the associated lines to indicate the server location of your choosing.
- Follow the directions in repository’s README to start the node server.
- In the android directory, find the feeld app. Install it on your favorite android device.
- Plug in the power sources for both the arduino and the buckle. If you power the arduino via USB, on the serial monitor, you should see the message *Advertising*.
- Open the android app and click "Connect" at the top. On the list of devices, you should see the device "UART," assuming the arduino is being powered. Click "UART" to connect to it.
- Now, readings from the knob on the buckle will be logged periodically as "RX: <reading>" and will be sent to the server. The server will send back the approachability of the closest feeld buckle, alert you of the value, and then change your buckle's temperature accordingly.
- Direct your browser to the server location of your choosing, and see how everyone's feelding!
Ideation
We were very interested in using a thermoelectric in our final design. We first played with more functional ideas, our favorite being a body temperature-regulating t-shirt. However, the longer we brainstormed, the more interested we became in using temperature as a signaling message for something else. Another idea that occurred to us was creating a bracelet for the game hide and go seek where the distance of the seeker to the hider triggered a temperature signal notifying the wearer how close they are the hider. However, we decided to be even more abstract and. We played around with several ideas, one of which was the metaphor of temperature as emotional distance or proximity, and ended up deciding to create a new social dimension where social intent is communicated through temperature.
Improvements and Future Vision
We envision taking feeld in a number of interesting directions going forward.
First, we are interested in either making feeld variations that focus on other components of social interaction, aside from approachability --- mood, energy, so on --- or in adding additional channels to feeld for expressing these components. To us, one of the most compelling aspects of feeld is the fact that it makes intangible social cues literally tangible. We believe this same approach can be fruitfully applied to other social signals.
We are also interested not just in displaying users' social data for them to explore, but in helping them to act on this data. One of the biggest complaints among users of quantified self technology is that although it helps users learn about themselves, it does not help them reach their goals. We would like to develop feeld to nudge users towards goals. Perhaps a given user wants to get out of his shell, become more social. He could adjust his target sociability rate up to 40%, and feeld could urge him to turn up his approachability now and then. Perhaps another user has been putting too little time into his studying and needs to focus. He could adjust his target rate down to 60%, and feeld could start subtly pestering him when he's getting offtrack. We think such interactions could help users greatly with their social goal setting.
Further, we think this new dataset opens a vast array of possibilities to social scientists, who often struggle to find ways to observe social signals on a large scale. We believe these signals would be particularly accurate and trustworthy, since users are deploying them to shape the behavior of those around them, and thus directly gain by providing accurate signals in a way that they would not typically gain by offering correct reports to social scientists' surveys. We expect collaboration with social scientists interested in approachability and social signaling would be very valuable from a research perspective.
We intentionally chose a neutral color for our prototype, because we intended feeld to be a discrete way of communicating social cues. However, In future iterations of this product, we like the idea of experimenting with the color and branding of the feeld belt clip, to make it a more expressive accessory. We see the physical home of the feeld as crucial to shaping the interaction.


_tgy9FMANCY.JPG?auto=compress%2Cformat&w=60&h=60&fit=min&dpr=2)


Comments