

Hardware components | ||||||
 |
| × | 1 | |||
| × | 1 | ||||
 |
| × | 1 | |||
| × | 1 | ||||
| × | 1 | ||||
 |
| × | 1 | |||
Software apps and online services | ||||||
 |
| |||||
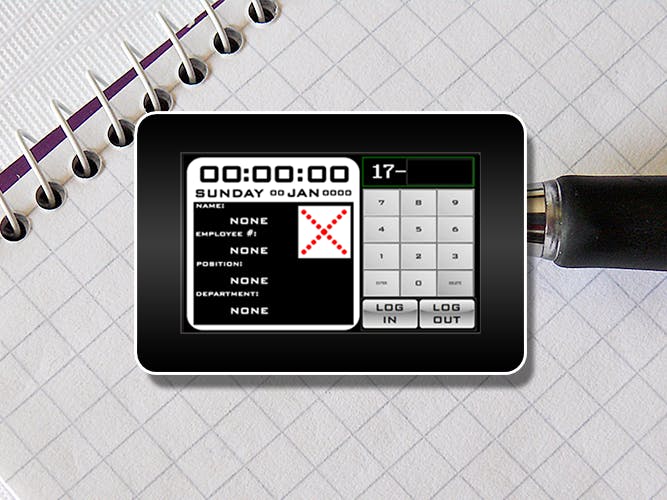
Manual Time Logger is an IOT device created for the purpose of logging the users attendance data over the internet (over to Google Spreadsheets)
The project works when a user manually logs his or her employee number, the project then compares and checks the employee number against is simple array database. If a match is found, the project continues by showing the employee’s records, the user is then prompt to choose if log-in or log-out activity, then upon choosing the activity prompt, the MOTG-WiFi-ESP will trigger a HTTP GET request to the Pushingbox API. The Pushingbox API will then trigger the web app script created inside the Google Spreadsheet.
The web app script inside the Google Spreadsheet app will parse the HTTP GET request sent by the Time Logger project and log the data into the spreadsheet.
The data sent by the Time Logger projects consists of activity (Log_In or Log_Out), timestamp which is composed of HH:MM:SS DD/MM/YY provided by the RTC and the employee number.
ImplementationStep 1: Build (Option 1)- Diagram using gen4-PA+MOTG to be added in future revisions.
- This option provides a built-in speaker from the gen4 PA+MOTG Breakout board.
- Build the circuit as shown in the diagram.
- The original instruction for this project is on this website:
https://www.hackster.io/detox/transmit-esp8266-data-to-google-sheets-8fc617
- First, create or use your existing Google Drive account. Create a spreadsheet and name it to your desire. Take note of the spreadsheet ID and save it.
- Next, on the Tools tab, select the Script Editor.
- Then, paste this customized code from the last section unto the code editor screen. Do not forget to change/add the spreadsheet ID inside the codes. After finishing, hit the File tab and select the Save All option.
- Then publish as a web app, clicking the Publish tab and select the “deploy as web app” on the drop down menu:
- Create a pushingbox account and log it in.
- On the top tab, select the “My Services”, and select the “Add a service”, then on the drop-down list, select the “CustomURL”:
- A pop-up box will appear, place your desired name on the first input box and place the script URL that you copied on step 2 on the second box:
- Next, we need to place a scenario from pushingbox, we can do this by going to the “My Scenarios” on the top tab. Rename you scenario and “Add a device”.
- You will be then prompted to a new page, where you will need to save the “device ID” indicated, after this, select the “Add an Action” Button:
- A new page will be loaded and will show the services you have created, select the one you named for the time logging project and hit the “Add an action with this service”, then a pop-up hover box will appear, insert the following codes for the input box “Data”:
activity=$activity$×tamp=$timestamp$&empNum=$empNum$
- To test if step 2 to 3 were properly performed, you can go to your desired browser’s url box.
- Enter the following line, you can try to change the values on the code to test, however, take note that the pushingbox API accepts 1000 send per day:
- Then check your Spreadsheet if a new data was added.
Open the project using Workshop 4 IDE. This project uses the Visi Environment.
- Download the project file here.
- You can modify the properties of each widget.
- Click on the “Build Copy/Load” button.
Note: This step could be skipped. However, compiling is essential for debugging purposes.
Step 7: Comp’n Load- Connect the display to the PC using uUSB-PA5 and a mini USB cable. Make sure that you are connected to the right port. Red Button indicates that the device is not connected, Blue Button indicates that the device is connected to the right port.
- Now click on the “(Build) Copy/Load” button.
- Workshop 4 IDE will prompt you to select a drive to copy the image files to a uSD Card. After selecting the correct drive, click OK.
- The module will prompt you to insert the uSD card.
- Unmount the uSD Card properly from the PC and insert it to the uSD Card slot of the display module.
On the right side, you can see the serial terminal COM0 acts as a debugger for the program, while on the left side the data was automatically added to the spreadsheet.


Comments
Please log in or sign up to comment.