INTRODUCTION:
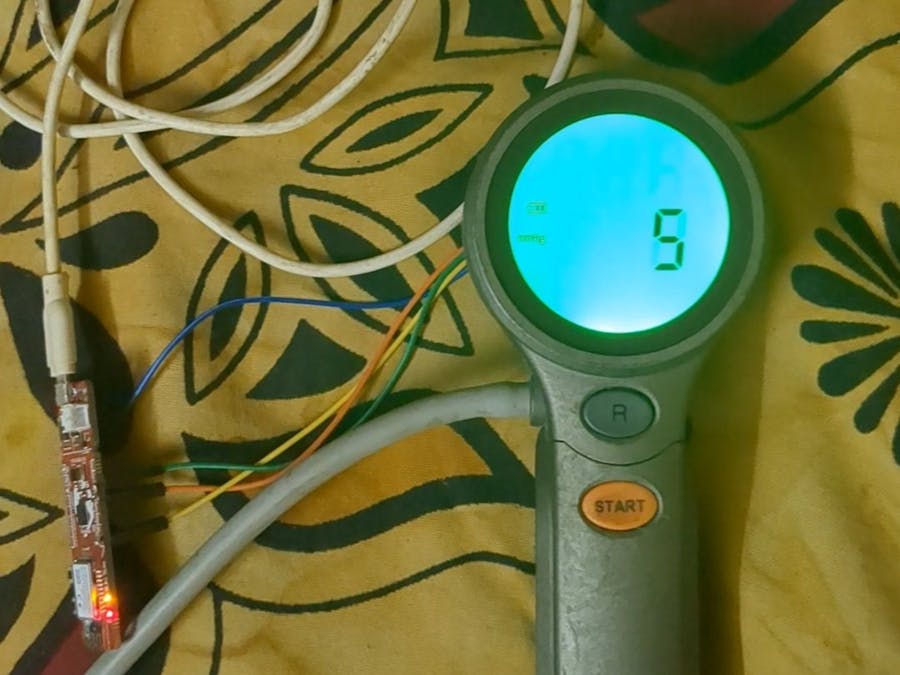
Imagine a world where checking your blood pressure is not easy but also smart. That's what our project is all about. We have connected a blood pressure monitor to an Avr IOT board using Arduino IDE. So, measuring your blood pressure magically Sends the human blood pressure readings from the Monitor straight into Google Sheets, like a Tech assistant keeping health data for you. We have added some cool features like your heart rate too! it's not just about numbers it's about making health info simple, secure, and right at your fingertips. Welcome to a smarter way of keeping an eye on your well-being!
Our project revolutionizes health monitoring by seamlessly connecting a Health Monitoring monitor to a Microchip AC164160 IoT board through Arduino IDE, Google Cloud IoT, Firebase, and Google Sheets. This abstract offers a concise overview of the project, emphasizing its significance, objectives, methods, and results.
In response to the complex process of Health Monitoring, our project leverages modern technologies to address the need for a smarter and more accessible health monitoring system. We aim to streamline the integration of non-smart Health Monitoring monitors with the Microchip IoT board, providing real-time data transfer to Google Sheets for efficient health data management.
Objectives: Our primary objectives include enhancing health data accessibility and interpretation by creating a user-friendly Web App Connecting to the Hardware. By seamlessly connecting a Health Monitoring monitor to the Microchip IoT board, we strive to empower individuals to monitor their vital signs easily and efficiently.
Proposed Solution: The project utilizes the Microchip IoT Google cloud development board, incorporating the ATmega4808, AVR MCU, ATECC608A Crypto Authentication secure element IC, and the ATWINC1510 Wi-Fi network controller. This combination enables a direct connection to Google's Cloud IoT platform, and it uses thehttps protocol to directly access Google Sheets facilitating the transfer of crucial health data. The proposed solution ensures a user-friendly, real-time data transfer system, enhancing monitoring efficiency, and this hardware is connected to a web app accessible by the users and provides end-to-end support.
Quick Starter Of the Board:
This is a quick start guide for Connecting the AVR-IoT To Wifi. You will need a board, a micro-USB cable, and a Wi-Fi connection!
Plug In:
Connect your board to your Windows, Mac, or Linux PC through a micro USB cable. Your PC will recognize the board as a removable storage drive CURIOSITY.
The CURIOSITY drive contains several files. Click on CLICK-ME.HTM to open your uniquely configured google cloud portal in a browser.
Enter your wireless network information on the page. Click Download Configuration to download the Wi-Fi® configuration file, WIFI.CFG.
Once your board is connected, you can immediately get into your temperature and light data through Microchip’s Google Cloud sandbox.
HARDWARE:
Microchip AC164160:
The AVR IoT WG development board integrates a robust ATmega 4808 AVR MCU, ATECO60BA Authentication secure element IC, and ATWINC1510 Wi-Fi controller simplifying connection to Google's Cloud lot core platform. Utilizing Arduino IDE and Apps Script, the board enables seamless Wi-Fi connection for data transmission from a Blood Pressure Monitor to Google Sheets. The BP takes measurements, and results are sent via HTTPS POST request. Apps Script then parses and populates Google Sheets, offering a straightforward and efficient solution for real-time health data integration, all managed on the versatile AVR IOT WG board.
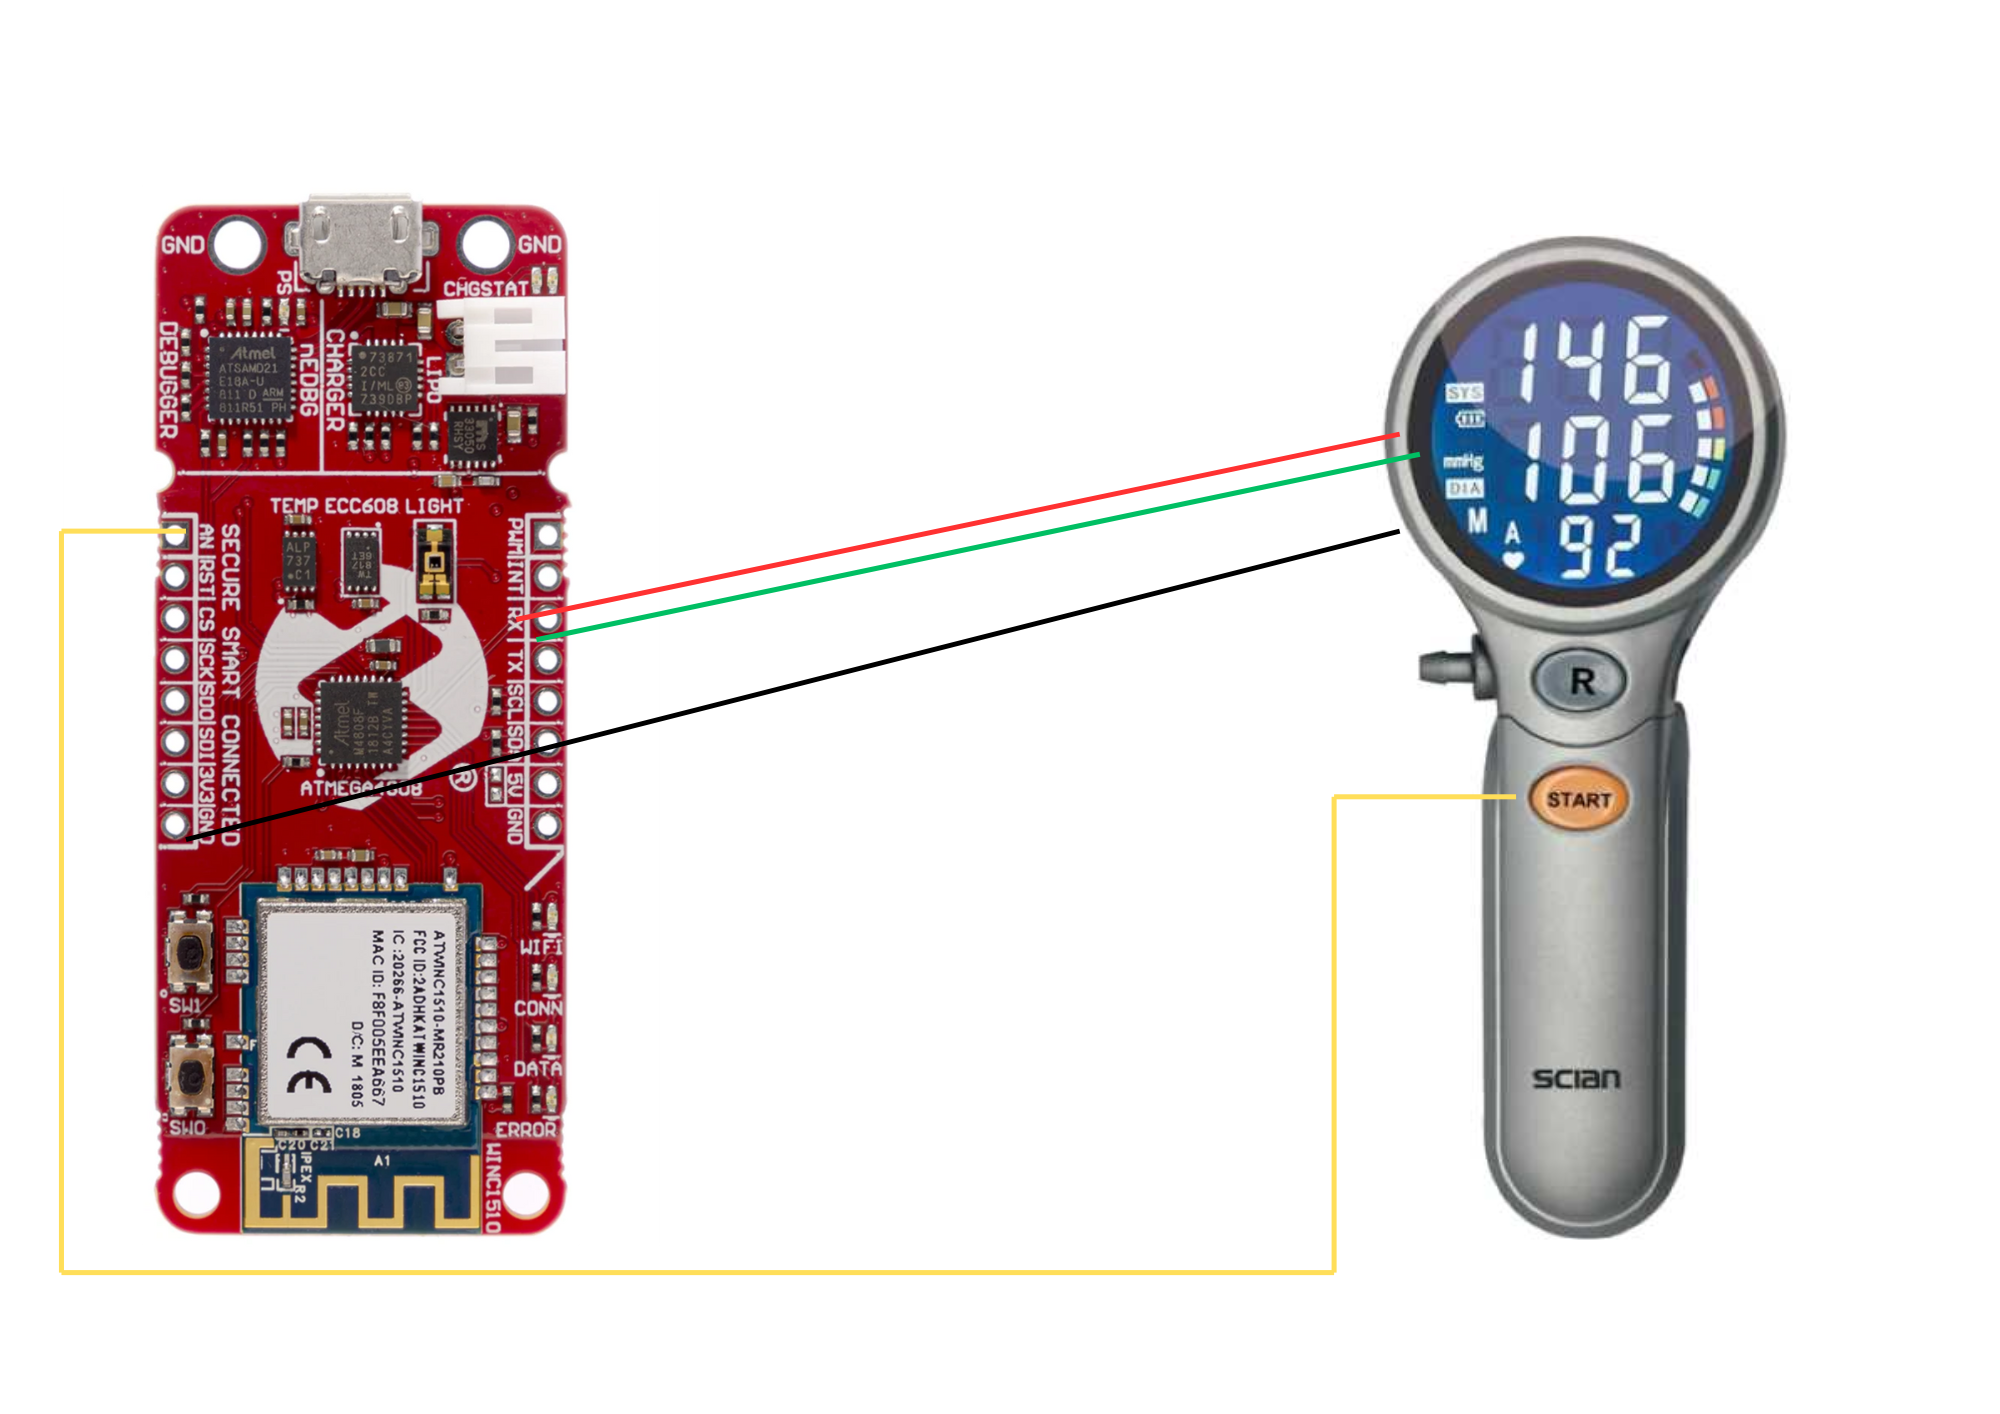
CIRCUIT CONNECTIONS:
SOFTWARE: we need to install the Arduino Libraries in Arduino IDE following the steps listed Wifi 101Arduino ECCX08Adafruit MCP9808
INSTALLING ATMEGA4808 Board:
- Open Arduino IDE.
- Open the File > Preferences menu item.
- Enter the following URL in Additional Boards Manager URLs:
https://mcudude.github.io/MegaCoreX/package_MCUdude_MegaCoreX_index.json- Separate the URLs using a comma (, ) if you have more than one URL
- Open the Tools > Board > Boards Manager... menu item.
- Wait for the platform indexes to finish downloading.
- Scroll down until you see the MegaCoreX entry and click on it.
- Click Install.
- After installation is complete close the Boards Manager window.GOOGLE-AppScript: Go to Google Drive And Create a New Sheet file
- Then a New Google Sheet will be created that click Extension> App Script
- In the Paste the Below Code
function ReadableDate(timestamp) {
  var d = new Date(timestamp);
  return d.getFullYear() + "-" + ("00" + (d.getMonth() + 1)).slice(-2) + "-" + ("00" + d.getDate()).slice(-2) + " " +
    ("00" + d.getHours()).slice(-2) + ":" + ("00" + d.getMinutes()).slice(-2) + ":" + ("00" + d.getSeconds()).slice(-2);
}

function ColorCode(SYS, DIA) {
  if (DIA < 80) {
    if (SYS < 120) return "lime";
    else if (SYS < 130) return "yellow";
  } else if (SYS > 180 || DIA > 120) return "red";
  else if (SYS >= 140 || DIA >= 90) return "brown";
  else if (SYS >= 130 || DIA >= 80) return "orange";
  else return "white";
}

// Run once HTTP post comes from Helium
function doPost(e) {
  var data = JSON.parse(e.postData.contents);
  var GS = SpreadsheetApp.openById('<SheetID>');
  //var SheetDate = new Date().toLocaleDateString();
  ThisSheet = GS.getSheetByName("Current Values");
  // Get all names and device UIDs
  var KeyValue = GS.getSheetByName("Patient-Device").getDataRange().getValues();
  // Device data with placeholder in case we don't have a name associated with the device
  var ThisRecord = [data.Device, data.SYS, data.DIA, data.PPM, data.Temp, ReadableDate(Date.now())];
  // Lookup patient name
  KeyValue.forEach(function (i) { if (i[1] == data.Device) { ThisRecord.shift(); ThisRecord.unshift(i[0]); } });
  // Save to spreadsheet
  ThisSheet.getRange(ThisSheet.getLastRow() + 1, 1, 1, ThisRecord.length).setValues([ThisRecord]);
  // Add color
  ThisSheet.getRange(ThisSheet.getLastRow(), 7).setBackground(ColorCode(ThisRecord[1], ThisRecord[2]));
}
Then Click Deploy And Click New DeployCopy the Deployment Website
OPEN ARDUINO IDE:
Open a New FilePaste the Below Code
#include <WiFi101.h>
#include <ArduinoECCX08.h>
#include "Adafruit_MCP9808.h"

#define LED_PIN_POWER 12
#define LED_PIN_BPM_READY 13
#define LED_PIN_WIFI 14
#define LED_PIN_SENT_DATA 15

WiFiSSLClient client;
Adafruit_MCP9808 tempsensor;

void setup() {
  pinMode(LED_PIN_POWER, OUTPUT);
  pinMode(LED_PIN_BPM_READY, OUTPUT);
  pinMode(LED_PIN_WIFI, OUTPUT);
  pinMode(LED_PIN_SENT_DATA, OUTPUT);

  digitalWrite(LED_PIN_POWER, HIGH); // Power LED On

  // Configure WiFi and connect
  WiFi.setPins(7, 22, 1, 23);
  WiFi.begin("<SSID>", "<password>");

  // Initialize ECCX08
  ECCX08.begin();
  String SN = ECCX08.serialNumber();
  ECCX08.end();

  // Initialize temperature sensor
  tempsensor.begin(0x18);
  tempsensor.wake();
  float temperature = tempsensor.readTempF();
  tempsensor.shutdown();

  // Control power to BPM
  pinMode(19, OUTPUT);
  digitalWrite(19, HIGH); // Power On
  delay(3000); // Wait for stability

  // Initialize serial communication with BPM
  Serial1.begin(38400);

  // Blink BPM Ready LED
  for (int i = 0; i < 4; i++) {
    digitalWrite(LED_PIN_BPM_READY, HIGH);
    delay(100);
    digitalWrite(LED_PIN_BPM_READY, LOW);
    delay(100);
  }

  // Read BPM data
  int SYS = 0, DIA = 0, PPM = 0;
  while (!readBPMData(SYS, DIA, PPM)) {
    delay(100); // Wait until BPM data is fully received
  }

  // Wait until connected to WiFi
  while (WiFi.status() != WL_CONNECTED) {
    digitalWrite(LED_PIN_WIFI, HIGH);
    delay(500);
    digitalWrite(LED_PIN_WIFI, LOW);
    delay(500);
  }

  // Construct JSON payload
  String payload = "{\"Device\":\"" + SN + "\",\"SYS\":" + String(SYS) + ",\"DIA\":" + String(DIA) + ",\"PPM\":" + String(PPM) + ",\"Temp\":" + String(temperature) + "}";

  // Send data to Google Script
  sendDataToGoogleScript(payload);

  // Indicate data transmission
  digitalWrite(LED_PIN_SENT_DATA, HIGH);
}

void loop() {
  // Nothing in loop for now
}

bool readBPMData(int& SYS, int& DIA, int& PPM) {
  static char data[20] = "";
  static int tempNum = 0;
  if (Serial1.available()) {
    char c = Serial1.read();
    if ((c >= 'a' && c <= 'z'))
      sprintf(data, "%s%c", data, c);
    else if (c == '\n') {
      if (strstr(data, "endtest") != NULL) {
        while (tempNum != 16) {
          if (Serial1.available()) {
            c = Serial1.read();
            switch (c) {
              case '0' ... '9':
                tempNum += (c - 48) * (tempNum > 15 ? 1 : 16);
                break;
              case 'A' ... 'F':
                tempNum += (c - 55) * (tempNum > 15 ? 1 : 16);
                break;
              case '\r':
                if (SYS == 0)
                  SYS = tempNum;
                else if (DIA == 0)
                  DIA = tempNum;
                else
                  PPM = tempNum;
                tempNum = 0;
                break;
            }
          }
        }
        return true; // Data fully received
      } else
        sprintf(data, "%s", "");
    }
  }
  return false; // Data not fully received yet
}

void sendDataToGoogleScript(String payload) {
  const char* host = "script.google.com";
  if (client.connect(host, 443)) {
    client.print("POST /macros/s/AKfycbyoSWcckb-yQXup4B3c7EZ3RAdPbsxjj2nrmuuPAOOUwDek2oJTI7J6-94WXY2MDpso/exec HTTP/1.1\r\n");
    client.print("Host: ");
    client.print(host);
    client.print("\r\n");
    client.print("Content-Type: application/json\r\n");
    client.print("Content-Length: ");
    client.print(payload.length());
    client.print("\r\n\r\n");
    client.print(payload);
  }
}
Then Upload it to the board using the below Board Configurations
OUTPUT: The output in Google Sheets
GOALS: Our project supports UN Goal 3: Good Health and Well-being, focusing on making health monitoring easier. We also contribute to Goal 11: Sustainable Cities and Communities using tech for smarter healthcare. The inspiration is to help people manage their health better and create innovative solutions for healthier, connected communities
FutureImprovements:
Web App Features: Complementing the hardware integration, our solution includes a feature-rich web app. This app provides a secure and personalized dashboard offering:
1. User Authentication and Profiles: Implementing secure user authentication and allowing users to create detailed profiles.
2. Real-Time Dashboard: Displaying visually appealing real-time Health Monitoring and heart rate readings.
3. Health Trends and Insights: Providing insights into health trends through analysis of historical data.
4. Notifications and Alerts: Implementing push notifications for abnormal readings and customizable alert thresholds.
5. Integration with Wearable Devices: Exploring the possibility of integrating data from other wearable devices.
6. Health Journal and Notes: Allowing users to add notes or journal entries related to their health.
7. Gamification and Rewards: Gamifying the health monitoring experience with challenges and achievements.
8. Educational Resources: Offering educational content on Health Monitoring, heart health, and general well-being.
9. Community and Social Sharing: Enabling users to connect with others through a community feature.
10. Data Export and Sharing: Allowing users to export health data and securely share it with healthcare professionals or family members.
Conclusion: In conclusion, our project offers a significant advancement in health monitoring, providing a connected healthcare approach. The seamless integration of Health Monitoring monitors with the Microchip Google AVR-IoT board and the feature-rich web app collectively enhance accessibility and management efficiency and provide an end-to-end user-friendly Platform. Utilizing tools like Google Sheets analytics and user feedback, we demonstrate the positive impact on health information accessibility and user engagement.


Comments