


Hardware components | ||||||
 |
| × | 1 | |||
| × | 1 | ||||
I got myself an Arduino MKR 1010 (with built-in WiFi+Bluetooth) and a 9-axis Arduino MKR IMU shield - let's capture some sensor data!
Local data logging
In this project we'll try two different methods, first USB and second Web Bluetooth, to stream data from the board to a local machine. This might be a useful starting point to collect sensor data to create ML datasets, for example.
IoT options not covered in this project
Using the MKR 1010's WiFi you can also securely send the sensor data to IoT platforms from AWS, Google or Microsoft using the ready-made examples or via Arduino IoT Cloud. In fact there are some nice Arduino libraries for JSON, HTTPS, OAuth so interfacing directly to pretty much any web service is possible.
If you swapped out the MKR 1010 board you could use other connectivity options such as LoRaWAN, SigFox, 2G/3G and even NB-IoT and LTE Cat-M!
Quick startHere's how to see a 3D model of your Arduino MKR 1010 moving in real-time:
- Connect your IMU Shield to your MKR 1010, and connect to your laptop/PC by USB
- Compile the BLE_IMU sketch and upload to your Arduino MKR 1010
- Load this web page in the Chrome browser on a nearby machine
- Press the green button on the webpage to pair to your Arduino
- Watch it go!
If you want to know more about data collection from Arduino MKR 1010 and the upcoming Arduino Nano 33 IoT, read on...
Reading IMU sensor dataThe sensor data for our project is provided by the Arduino MKR IMU shield with a 9-axis Bosch BNO55 IMU on board.
The MKRIMU library gives us a simple interface to read the IMU sensor registers. It allows you to read three axes (x, y and z) of each of the three sensor types (accelerometer, gyro and magnetometer) giving us a total of 9 axes. For example:
IMU.readAcceleration(ax, ay, az);  // acceleration in straight lines
IMU.readGyroscope(gx, gy, gz);     // how fast it is spinning
IMU.readMagneticField(mx, my, mz); // used as a digital compass
A nice feature of this IMU is a dedicated Arm Cortex-M0+ CPU inside the sensor package that uses the sensor values to calculate the orientation of the board for us. All we need to do track orientation is read Euler angles from the IMU shield using one simple function call:
IMU.readEulerAngles(ex, ey, ez); // orientation <<-- we'll use this
If you want to log movements of the board the most direct way is to use the same USB cable you plug into your Arduino to program it.
Arduino MKR1010 setup
We'll use the Arduino_JSON library to write our sensor readings to serial; formatted as a list of JSON objects separated by a newline. A copy of the JSON log Arduino sketch can be found here for you to try.
PC or laptop setup
In a linux terminal you will be able to see your Arduino serial connection using:
ls /dev/cu.*
Your Arduino will be in the form of /dev/cu.usbmodem[nnnn]
/dev/cu.Bluetooth-Incoming-Port
/dev/cu.MALS
/dev/cu.SOC
/dev/cu.iPhone-WirelessiAPv2
/dev/cu.usbmodem1451           <-- in my case it's this one!
You can use this the view Arduino's serial output in Linux. (Remember to disconnect your Arduino IDE Serial Monitor otherwise you will see a Resource busy error message.)
cat /dev/cu.usbmodem14511
{"ms":1561,"ex":356.25,"ey":4.875,"ez":3.5}
{"ms":1591,"ex":358.9375,"ey":-0.4375,"ez":0.0625}
{"ms":1624,"ex":0.5,"ey":-3.6875,"ez":-0.125}
{"ms":1654,"ex":1.625,"ey":-5.125,"ez":0.0625}
{"ms":1684,"ex":359.75,"ey":-3.5625,"ez":0.0625}
{"ms":1715,"ex":348.25,"ey":9.8125,"ez":0.625}
{"ms":1746,"ex":342.8125,"ey":22.25,"ez":2.75}
{"ms":1777,"ex":338.875,"ey":31.625,"ez":5.75}
{"ms":1809,"ex":336.5,"ey":37.75,"ez":9.8125}
You can now save your data as a log file, do some parsing and processing.
Sending data from Arduino over BluetoothArduino MKR1010 setup
Bluetooth is a quick and easy way to connect the Arduino to a local machine. The BLE_IMU sketch is what we'll run on the Arduino in order to connect to our web browser.
Our sketch uses the ArduinoBLE library which has nice examples for creating a Bluetooth connected projects. This is how we will send the data from the device.
Don't forget to update your Arduino MKR 1010 firmware if needed.
Our Euler angles are three single precision floating point variables, which each take up 4 bytes. We're packing them into 12 byte array to send in one BLE packet. Here's where in the sketch the sending happens:
void sendSensorData() {
float eulers[3];
// read
IMU.readEulerAngles(eulers[0], eulers[1], eulers[2]);
// Send over bluetooth - casting 3x euler floats as 1x byte array
imuCharacteristic.setValue((byte *) &eulers, 12);
}
Using Web Bluetooth we can build a webpage so that our Arduino board can connect and stream data to the browser.
You can see the full webpage here - if your Arduino is powered and running the BLE_IMU sketch you'll be able to connect to it. N.B. You'll need to check your browser supports Web Bluetooth. We tested this project with Chrome.
JavaScript and WebBLE
Tom Igoe made a cool little JavaScript Web Bluetooth example we used as the basis to create our webpage. The BLE UUID and Characteristic IDs used here need to be the same as those used in the sketch running on your Arduino in order to connect.
The magic line that listens for incoming Bluetooth data from the Arduino is here:
characteristics[c].addEventListener('characteristicvaluechanged', handleData);
Unpacking the euler values with JavaScript DataViews
You'll remember our Arduino sketch packs the 3x floats (for euler x, y and z) into a single array, so we'll unpack them using JavaScript DataViews.
One gotcha to note is that Arduino is sending variables as little endian and JavaScript DataViews default to Big Endian. We have to add a parameter to make sure our floats come out correctly
function handleData(event) {
 // get the data from the peripheral
 // true = byte order from Arduino is littleEndian
 var x = event.target.value.getFloat32(0,true);
 var y = event.target.value.getFloat32(4,true);
 var z = event.target.value.getFloat32(8,true);
We now have the same x, y, z values we sent from the Arduino available in our web browser!
Visualization and digital twin
Now we have the 3D orientation of our Arduino board streaming to a webpage we can do some fun stuff with it.
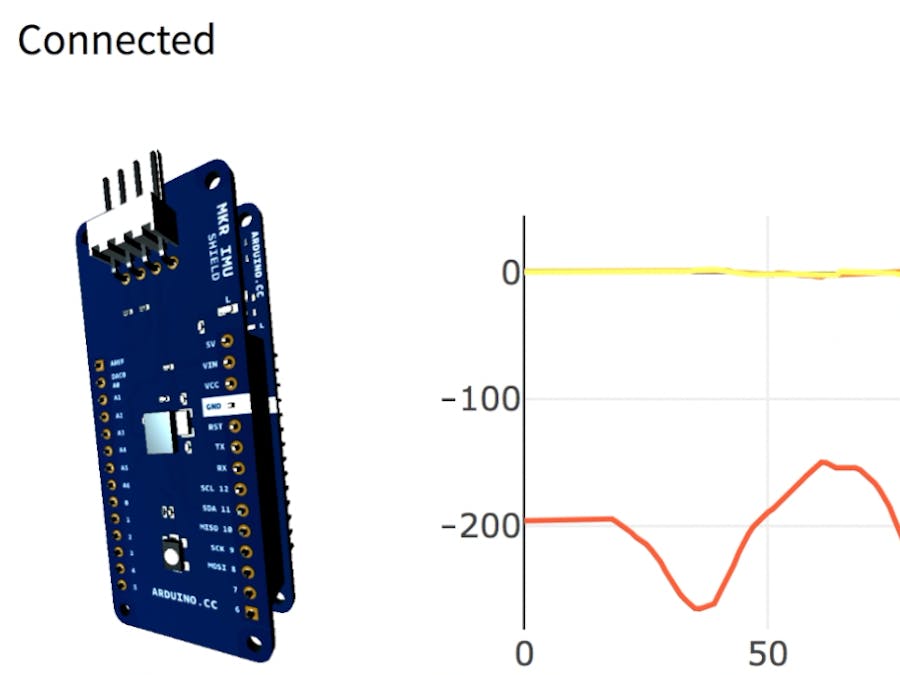
We'll render a real-time graph using Plotly JavaScript Open Source Graphing Library representing the x, y and z axis.
Using a Blender model of the MKR board we exported as a GLTF model, we can animate a simple scene using the Three 3D Library.


Comments
Please log in or sign up to comment.