


Hardware components | ||||||
 |
| × | 1 | |||
 |
| × | 1 | |||
 |
| × | 1 | |||
 |
| × | 1 | |||
 |
| × | 1 | |||
 |
| × | 1 | |||
 |
| × | 1 | |||
 |
| × | 1 | |||
Software apps and online services | ||||||
 |
| |||||
| ||||||
 |
| |||||
Copy the web app URL that appears and click OK. The copied URL will be our webhook the IoT Cloud will use to access the Google app. We must copy this URL in the IoT Cloud edit view under webhook and click Update.
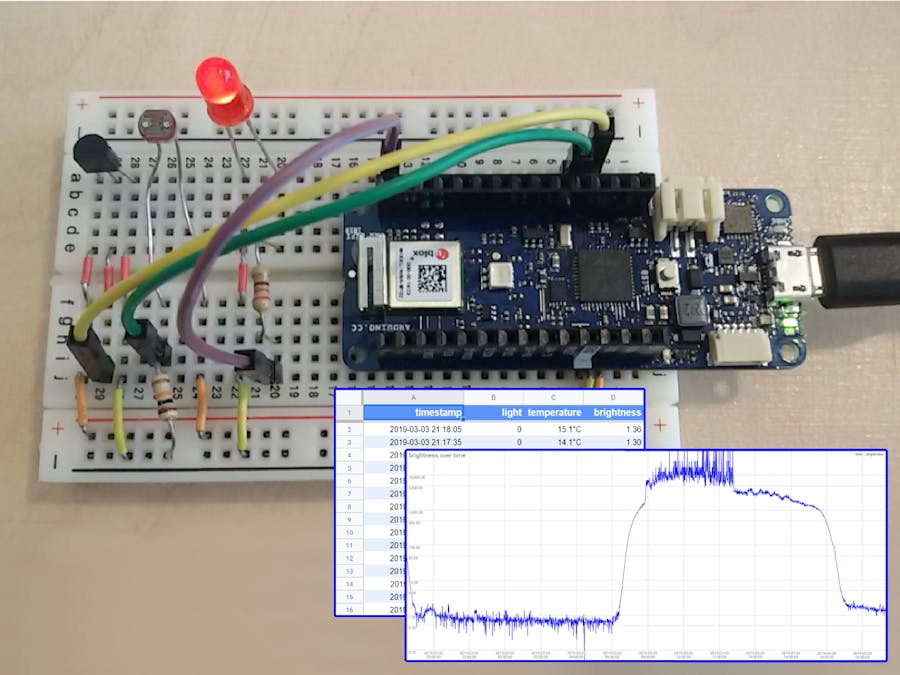
In this tutorial, we will show how we can use webhooks in the Arduino IoT Cloud to send data to Google Sheets and update tables and charts in real-time!
If you are new to Arduino IoT Cloud, we suggest to first follow this tutorial which will give you an overview of how this platform works.
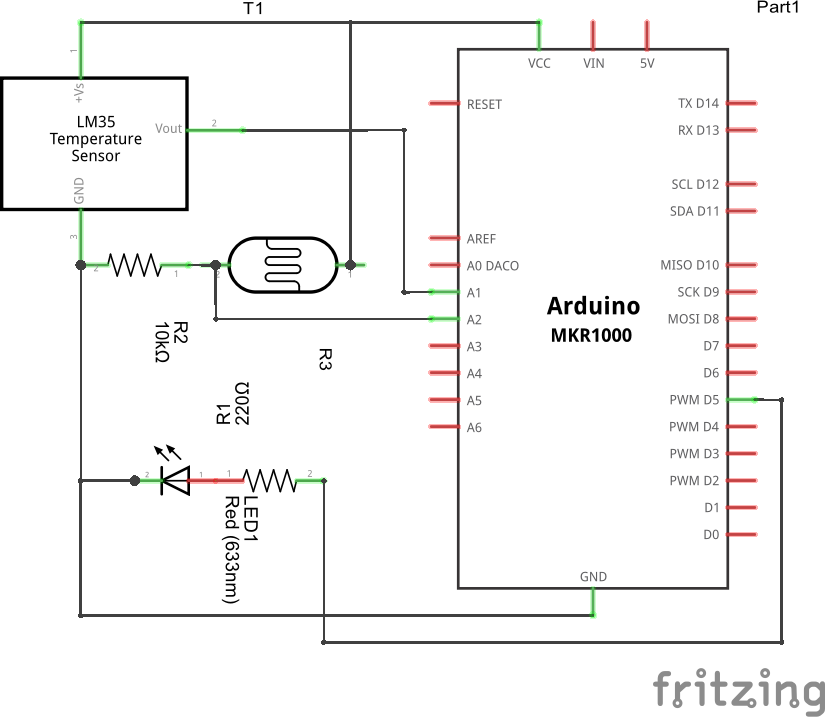
Part 1: Build the CircuitFirst of all, we need to build the circuit! As shown in the figure below, our circuit consists of an Arduino MKR WiFi 1010 board (or MKR 1000) and three main components: a temperature sensor, a photocell, and an LED. If you don’t have these specific sensors, you can use other ones or potentiometers as long as they can be connected to analog pins on the board.
The temperature sensor is connected to Vcc and ground through its left and right pins respectively, while its middle
Pin is connected to the Analog Pin A1 on the MKR WiFi 1010. The photocell is connected to Vcc and to ground through a 10k resistor; the signal is acquired by the Analog Pin A2 on the board. Finally, the negative leg of the LED is connected to ground, while its positive leg is connected to Digital Pin 5 of the MKR WiFi 1010 through a 220Ohm resistor.
That’s it! Now we can move to Arduino IoT Cloud.
Part 2: Arduino IoT CloudIn the IoT Cloud page, we create a new thing by giving it a name and selecting the board we are using (remember to configure the board first by following the getting started procedure).
Once done, we add three properties to our thing. The first property will be the temperature which will be read by the temperature sensor. We assign this property a type Temperature (Celsius) and set its limits to 0 and 40. We set permission to Read Only and update it regularly every 30 seconds.
Next, we add a second property called brightness with type Lumen and limits of 0 and 3000. Permission and update are set as in the previous property.
Finally, we add a property called light with type ON/OFF (Boolean) and set permission and update as for temperature and brightness.
Here it is how the edit and dashboard views of your Thing should look like at this point:
Note: update times do not need to be the same for each property, however, we suggest to choose one single value to avoid communication problems between the cloud and Google Sheets. Moreover, try not to set too low update times (stay above 30 seconds) since some time is required for the info sent from the cloud to be processed and for the spreadsheet to be updated.
Now go to the Web Editor by clicking the Edit Code button in the edit view of your thing.
Part 3: Arduino Web EditorIn the Web Editor we need to add some code to the template sketch that has been generated. First, before the setup function, we define three constants for the board pins that will be used:
#define PIN_TEMP A1
#define PIN_BRIGHT A2
#define PIN_LED 5
Next, in the setup function, we initialize pin modes:
pinMode(PIN_TEMP, INPUT);
pinMode(PIN_BRIGHT, INPUT);
pinMode(PIN_LED, OUTPUT);
In the loop function we read analog values from the temperature and brightness sensors:
int tempSensor = analogRead(PIN_TEMP);
int brightSensor = analogRead(PIN_BRIGHT);
and map them to the temperature and brightness variables which are linked to the properties of our thing in the cloud:
temperature = ((tempSensor * 3.3) / 1024.0 - 0.5) * 100.0;
brightness = 500 / (10.0 * (3.3 - (float)brightSensor / 1023 * 3.3) / ((float)brightSensor / 1023 * 3.3));
Finally, we turn on the LED if the temperature rises above a specific threshold (25°C in our case), by using this piece of code:
if (temperature > 25.0) {
   light = HIGH;
 } else {
   light = LOW;
 }
 digitalWrite(PIN_LED, light);
 delay(500);
Note: the temperature and brightness maps depend on the specific types of sensor used, so you may need to slightly change them.
Now we can fill the Secret Tab with our WiFi credentials and then upload the sketch to our Arduino board. When the sketch is uploaded, the board should connect to the cloud (we can check by opening the Serial Monitor) and we should see values changing every 30s in the dashboard view of IoT Cloud.
Part 4: Google Apps ScriptNow let’s put aside the Arduino part of this project and let’s concentrate on the Google app.
First thing first, go to Google Sheets and create a new blank spreadsheet. Rename the sheet to something like “RawData”, then click on Tools > Script Editor to open Google Apps Script.
In the window that appears we can write some code that will be executed whenever a message is sent from the IoT Cloud using webhooks. Our goal is to read incoming data from the cloud and write them in a spreadsheet as a table. We want to write not only the properties’ values but also the date and time at which they are updated.
You can find the entire Code.gs at the end of this tutorial. Let’s analyze it line by line!
First, we define variables for our spreadsheet and for the sheet which will contain numerical data:
var ss = SpreadsheetApp.getActiveSheet();
var sheet = ss.getSheetByName('RawData');
Here we define some constants:
var MAX_ROWS = 1440;   // max number of data rows to display
var HEADER_ROW = 1;    // row index of header
var TIMESTAMP_COL = 1; // column index of the timestamp column
We define MAX_ROWS because we want to maintain constant the number of rows of our table, i.e. each time an extra row is written, we delete the last one. In order to define MAX_ROWS we have chosen a total buffer time of 12 hours, then considering that the Cloud updates properties every 30 seconds, we can calculate MAX_ROWS = 3600s / 30s * 12h = 1440.
The function doPost(e) {} receives post request from the IoT Cloud and stores the incoming data into the variable e. Inside this function, we will automatically update our spreadsheet.
In order to get sensible data from e, we have to interpret it as a JSON object:
var cloudData = JSON.parse(e.postData.contents);
cloudData is now a JSON object with the following structure:
{webhook_id: 312064b8-ea32-5711-959b-6643b8ce8d2c,
 device_id:  268a4d5e-d882-4961-9fff-abc42b641142,
 thing_id:   d161b2f0-a830-4c01-b0d7-6cdf0d9f6456,
 values:     [{id:         1552695e-50b8-4cd3-b2c7-826bdeedb0ec,
               name:       light,
               value:      true,
               persist:    false,
               updated_at: 2019-02-25T09:59:52.14Z,
               created_by: f5d24652-25f8-4295-abce-d056ac47b3d8},...,{}]}
Notice that the values field is itself an array of JSON objects!
We can extract parameters from cloudData in the following way:
var webhook_id = cloudData.webhook_id;
var device_id = cloudData.device_id;
var thing_id = cloudData.thing_id;
var values = cloudData.values;
Next we store names and values in separate arrays just to make things more manageable:
var incLength = values.length;
var incNames = [];
var incValues = [];
for (var i = 0; i < incLength; i++) {
  incNames[i] = values[i].name;
}
Now we read the timestamp of the incoming message and we turn it into a javascript date object. Since the timestamp is already formatted as yyyy-MM-ddTHH:mm:ss.mmmZ, we can use the Date.parse() method:
var timestamp = values[0].updated_at;
var date = new Date(Date.parse(timestamp));
Due to inconsistency and presence of duplicate messages, we add some checks so to accept messages in ascending order with respect to time:
if (date.getYear() > 2018) {
  // discard all messages that arrive 'late'
  if (sheet.getRange(HEADER_ROW+1, 1).getValue() != '') { // for the first time app is run
    var now = new Date();
    var COMM_TIME = 5; // rough overestimate of communication time between cloud and app
    if (now.getTime() - date.getTime() > COMM_TIME * 1000) {
      return;
    }
  }
  ... // here goes stuff discussed below
}
Important note: adjust COMM_TIME based on the WiFi connection quality of your board! Moreover, COMM_TIME must be smaller than the update interval chosen in the IoT Cloud (30s in our case).
If the incoming message gets through previous checks, we can start writing data into our spreadsheet.
The following code block automatically detects properties’ names and writes them in the header row.
sheet.getRange(HEADER_ROW, 1).setValue('timestamp');
  for (var i = 0; i < incLength; i++) {
    var lastCol = sheet.getLastColumn();
    if (lastCol == 1) {
      sheet.getRange(HEADER_ROW, lastCol + 1).setValue(incNames[i]);
    } else {
      // check if the name is already in header
      var found = 0;
      for (var col = 2; col <= lastCol; col++) {
        if (sheet.getRange(HEADER_ROW, col).getValue() == incNames[i]) {
          found = 1;
          break;
        }
      }
      if (found == 0) {
        sheet.getRange(HEADER_ROW, lastCol+1).setValue(incNames[i]);
      }
    }
  }
Next we delete the last row, if the maximum number of rows has been reached:
var lastCol = sheet.getLastColumn();
var lastRow = sheet.getLastRow();
if (lastRow > MAX_ROWS + HEADER_ROW - 1) {
  sheet.deleteRow(lastRow);
}
We insert a new row, specifying its style:
sheet.insertRowAfter(HEADER_ROW);
var range = sheet.getRange('A2:Z2');
range.setFontColor('#000000');
range.setFontSize(10);
range.setFontWeight('normal');
And finally, we write the timestamp and all other values:
sheet.getRange(HEADER_ROW+1, TIMESTAMP_COL).setValue(date).setNumberFormat("yyyy-MM-dd HH:mm:ss");
    // first copy previous values
    // this is to avoid empty cells if not all properties are updated at the same time
    sheet.getRange(HEADER_ROW+1, col).setValue(sheet.getRange(HEADER_ROW+2, col).getValue());
    for (var i = 0; i < incLength; i++) {
      var currentName = sheet.getRange(HEADER_ROW, col).getValue();
      if (currentName == incNames[i]) {
        // turn boolean values into 0/1, otherwise google sheets interprets them as labels in the graph
        if (incValues[i] == true) {
          incValues[i] = 1;
        } else if (incValues[i] == false) {
          incValues[i] = 0;
        }
        sheet.getRange(HEADER_ROW+1, col).setValue(incValues[i]);
      }
    }
  }
And the code is done! We are almost finished!
In order to actually use this code we first need to publish it, thus go to Publish > Deploy as web app. If you’ve never saved the project before you will be asked to name it. In the popup window select a new project version and make sure to give access to the app to “anyone, even anonymous”, then click on deploy.
Copy the web app URL that appears and click OK.
The copied URL will be our webhook the IoT Cloud will use to access the Google app. We must copy this URL in the IoT Cloud edit view under webhook and click Update.
At this point, let’s power our circuit! If everything is working correctly, after the board is connected to the cloud we should see rows appearing in our spreadsheet once every 30 seconds. Remember that there is a bit of delay between the cloud and the spreadsheet updates, so don’t worry if the timestamps don’t match up perfectly with the actual time: they should have a delay of some seconds, depending on the quality of the WiFi connection.
Part 5: Create Charts!If you did it up to here, be aware that the hard work has been done! The only thing that remains to do is to create cool charts and add some style to our spreadsheet! For example, we can make the header text bold, change its color and set alternating colors for other rows. We can also choose specific date and number formats for each column by going to Format > Number.
In order to add a chart, select the timestamp column and another column (you need to select the entire column, not a limited range), then click on the chart icon, and a new chart will be created. To avoid problems due to scrolling of the sheets when a new row is added, click on the three dots on the top right of the chart window and click on Move to own sheet. This will move the chart into a new sheet and from there we can customize it as we want by clicking the Edit button.


Comments
Please log in or sign up to comment.