


Hardware components | ||||||
 |
| × | 1 | |||
 |
| × | 1 | |||
 |
| × | 1 | |||
 |
| × | 1 | |||
Software apps and online services | ||||||
 |
| |||||
I had a problem with my A/C and I wanted to control the temperature and the humidity. I found that the best way was using the arduino, websockets, a DHT11 sensor and a web browser.
The first problem I got was to find a websockets library that works in the MKR1000.
Finally somebody in arduino.stackexchange.com recommended me the NINA-Websocket library from Ocrdu that works perfect..
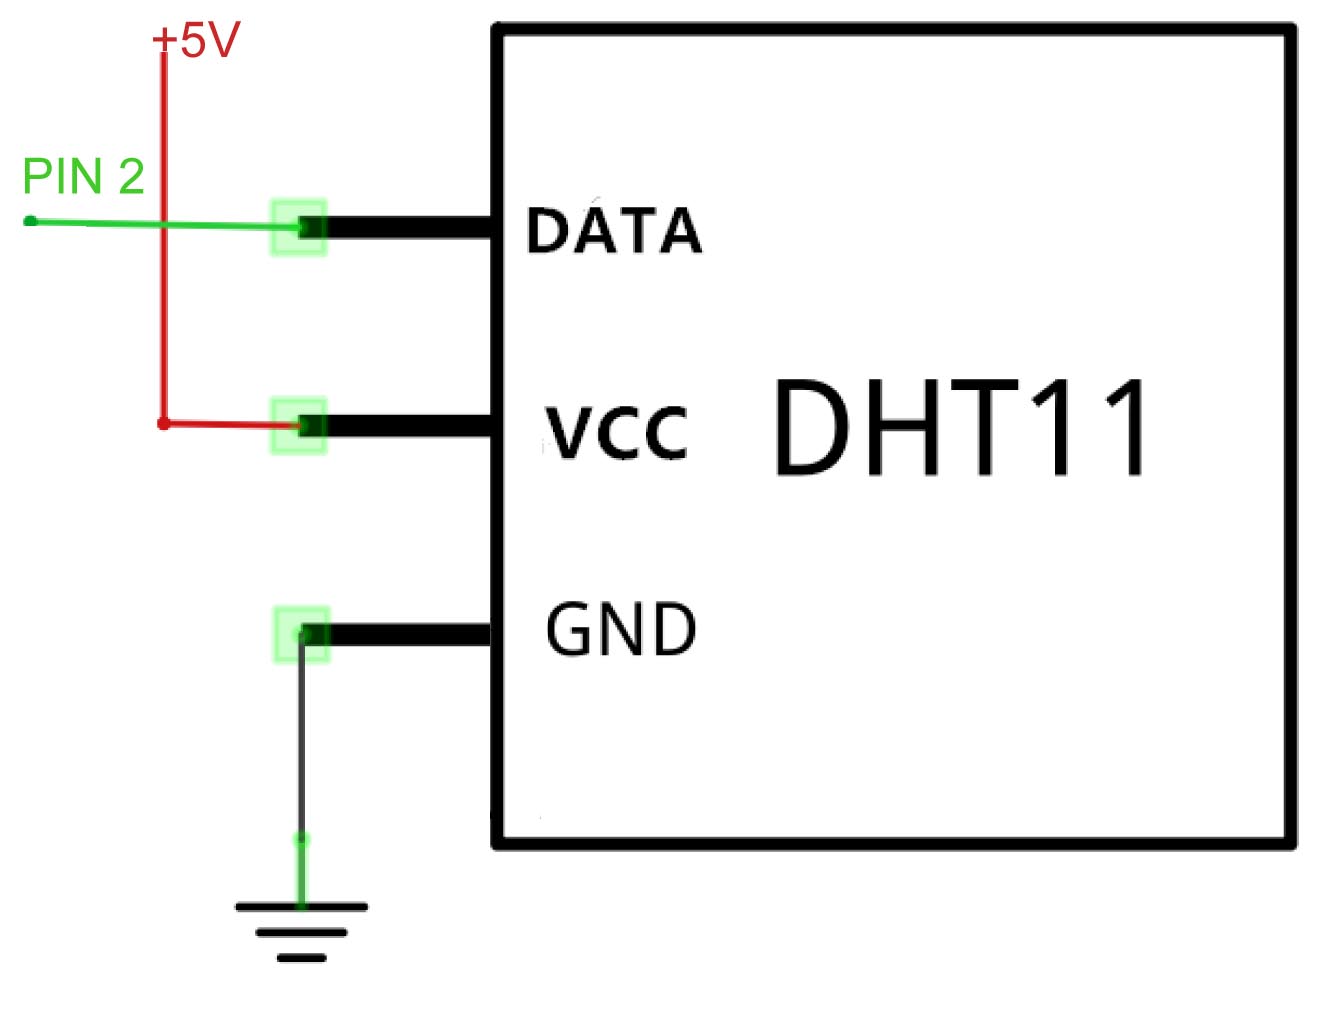
The arduino is connected to the DHT11 sensor using digital pin 2 to the DHT11 signal pin (view diagram). This pin may be changed in the code using the variable DHTPIN. DHT11 send every 2 seconds a sample of comma separated values of temperature & humidity.
Now the process is like this:
1. The MKR1000 connects to wifi and sends to serial monitor the connection info (IP and others). When the wifi is not connected the built in led is off and on when it is connected.
2. It wait for a client to connect.
3. To connect to the server from the client, you have to enter in the client the IP(from 1.) and the port selected (defaults is 80), again you may change in the code this value using variable webSocketPort, the value you have to enter in the web browser is like this:
http://IP:websocketport,
ie.http://192.168.1.100:80.
Then click open and the chart start to receive data from the arduino and displayed it.4. When the client is connected, it starts to send the sensor data to the client and the built in led blink.
5. The data the client receives every two second approx is displayed on the chart.

Comments
Please log in or sign up to comment.