


Hardware components | ||||||
 |
| × | 1 | |||
 |
| × | 1 | |||
 |
| × | 1 | |||
 |
| × | 1 | |||
Software apps and online services | ||||||
 |
| |||||
This project is the sane I did for Arduino MKR1000 and I adapted for raspberry pi 2.
I had a problem with my A/C and I wanted to control the temperature and the humidity. I found that the best way was using the Raspberry, websockets, a DHT11 sensor and a web browser.
I found in the web a Websocket software made by Theldus (https://github.com/Theldus/wsServer), I modified it to suit my needs and I compiled it into a library.
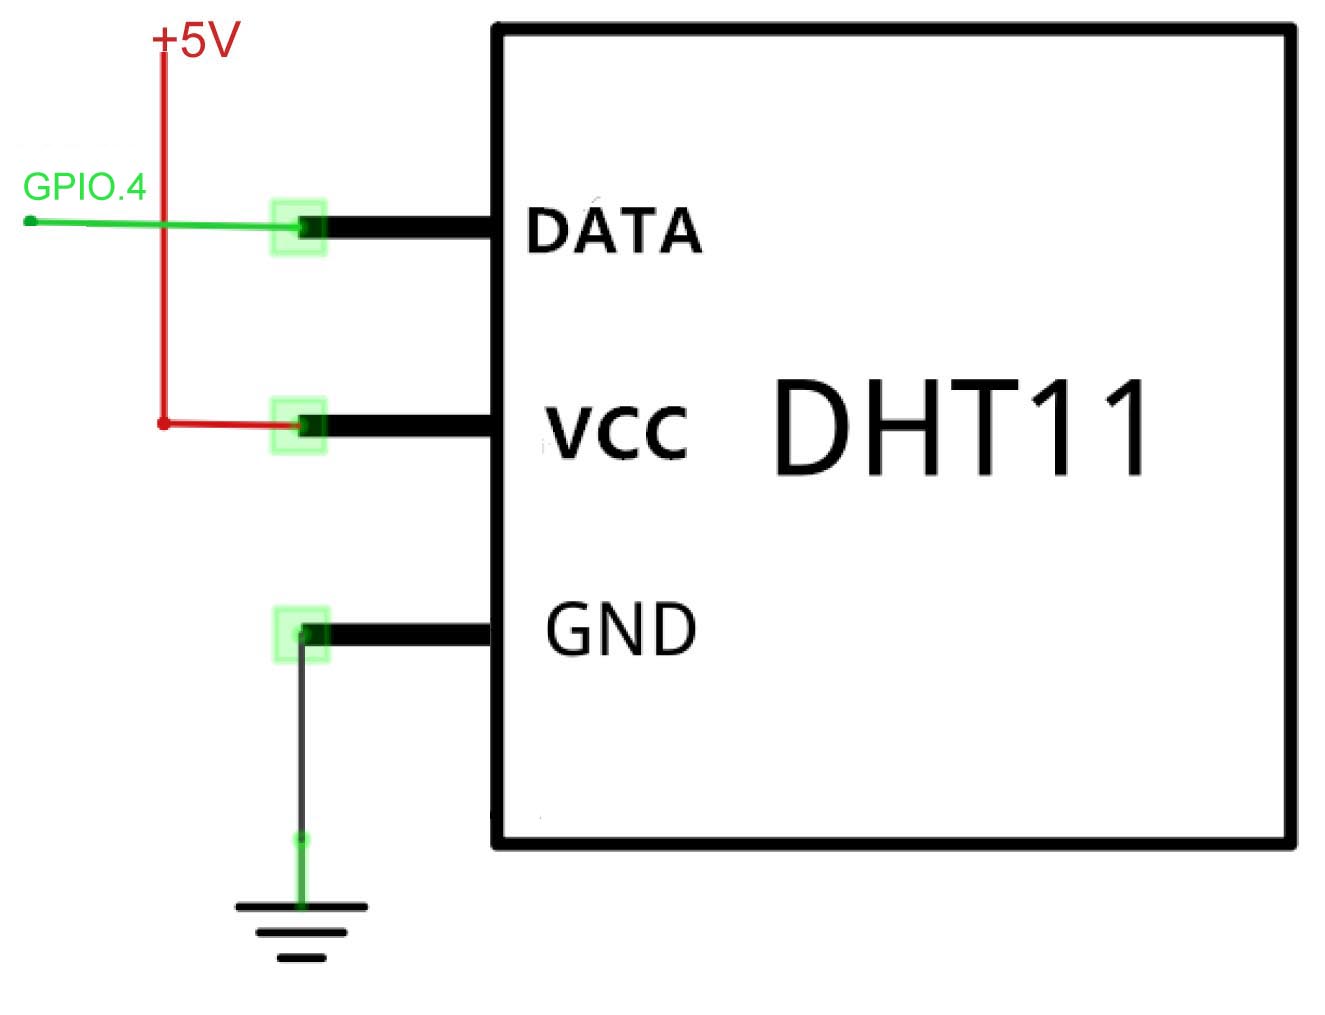
The RPII is connected to to 3v3 and the DHT11 sensor using digital pin GPIO.4 to the DHT11 signal pin (view diagram). This pin may be changed, it is an argument of the command line of the program. DHT11 send every 2 seconds a sample of comma separated values of temperature & humidity.
This are the steps you need to follow to setup and run it:
1. Download the source.zip(from Schematics and Circuit Diagrams Section), unzip in a directory you choose( for instance /home/pi) and run the following commands:
2. cd to directory and do the following:
pi@raspberrypi2:~ $ unzip Source.zip
pi@raspberrypi2:~ $ cd  wsServer
pi@raspberrypi2:~/wsServer $ make
pi@raspberrypi2:~/wsServer $ make  install
pi@raspberrypi2:~/wsServer $ cd ../dht11
pi@raspberrypi2:~/dht11 $ make
pi@raspberrypi2:~/dht11 $ make  install
pi@raspberrypi2:~/dht11 $ cd ..dht11WebSocket
pi@raspberrypi2:~/dht11WebSocket $ make
3. now you have the compiled program dht11WebSocket in the same name folder.
4. You can modify it dht11WebSocket.c, if you need, and then run the last make again:
5. At the RPII prompt you run : dht11WebSocket <Pin Number>
and when you get the message "Waiting for incoming connections..." you are ready to connect to the websocket server.
6. To connect to dht11WebSocket from the client, you have to enter in the client the IP(from you raspberry.) and the port selected (defaults is 8888), again you may change in the code this value using variable port, the value you have to enter in the web browser is like this:
http://IP:websocketport, ie. http://192.168.1.100:8888.
7. When the client is connected, the server starts to send the sensor data to the client and the data the client receives every two second approx. is displayed on the chart.
8. Attached is the source code for dht11 and wsServer libraries and dht11WebSocket program (sources.zip)

Comments
Please log in or sign up to comment.