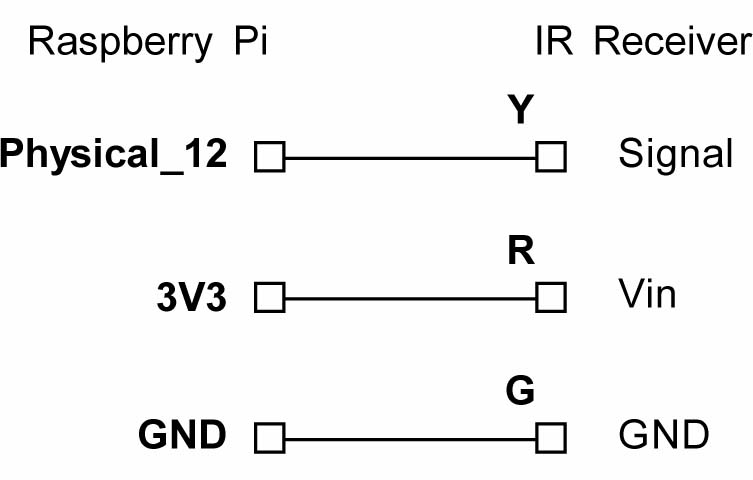
I was trying to use an IR remote control from Elegoo in my raspberry pi and when I tried to use the lirc method following this link, I couldn't register my control. So, following the example of ossoyoo in python I convert the IRCode.py to C and add some extras to understand what the pulses, coming from the remote, means and how to interpret that signal.
I connect the IR receiver to the raspberry according to the schematics above
I added to the software a writeFile routine to get in a file list of pulses read by the raspberry during 80ms. Then I use Excel to graph that signal in a XY chart, that looks that an oscilloscope output.
You can see in the chart the graph you get when you pressed the power button. As you can see the first long LOW, the first long HIGH and the last long HIGH are discarded.
If you see in the chart, you can look at the code you can see that all LOW signals ("0") are discarded in the decode routine, and only HIGH's ("1") are analyzed. You can see the smaller LOW pulse widths are similar in length to the HIGH pulses, this pulse width is a binary 0, the other HIGH pulses that are double the smaller are binary 1. I wrote the binary equivalent of every pulse in the graph and also and I converted to hexadecimal to compare with the value of the software.
Bellow is the chart with the annotations.
I hope this explanation helps to understand better the IR remote controls.


Comments
Please log in or sign up to comment.