


_ztBMuBhMHo.jpg?auto=compress%2Cformat&w=48&h=48&fit=fill&bg=ffffff)


In this tutorial, you will learn how to plot graphs on serial plotter data. I will show how to plot variable values, analog values, single graph as well as multiple graphs on the serial monitor option.
You will get lot of code examples as well as simulation diagrams. Let us get started.
Components needed- Arduino UNO
- Potentiometer
- Dupont cables
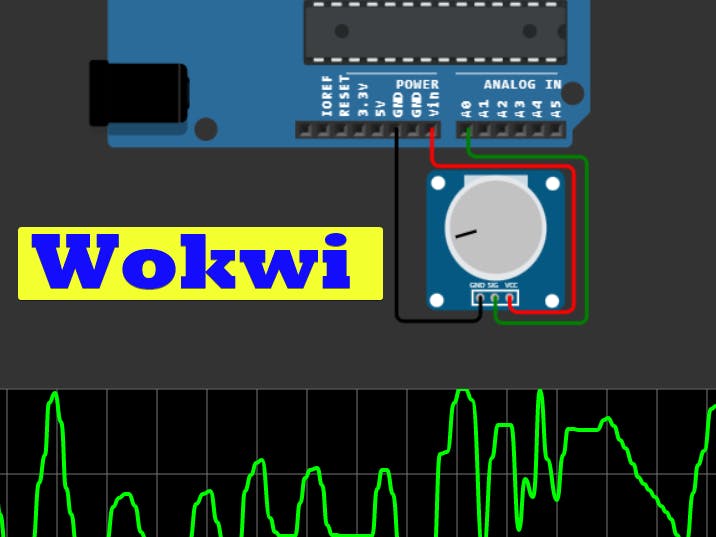
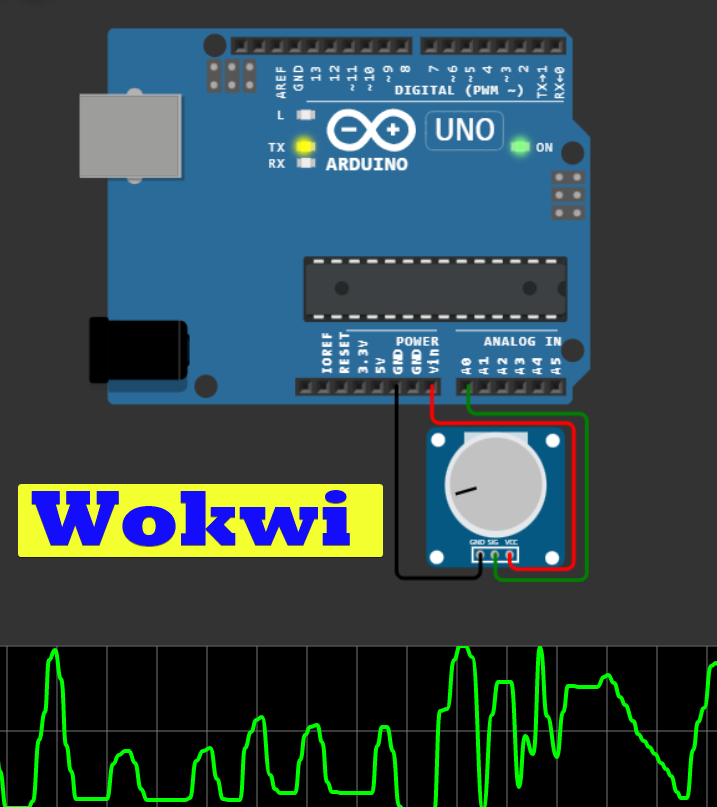
The serial plotter on Wokwi Arduino simulator as well as on Arduino. The value gets updated once every loop() cycle. This gets plotted on a continuous basis.
So here is one such example
void setup() {
Serial.begin(115200);
pinMode(A0, INPUT);
}
void loop() {
int value = analogRead(A0);
Serial.println(value);
delay(100);
}
As soon as you run this code on Wokwi Arduino Simulator, you will see the plotter opened. You can see the below animation to see how the example looks.
You just have to make sure you do Serial.println()
The trick is to "\r\n" which are new line and carrier feed characters in ASCII. These gets added automatically when you use Serial.println()
Project link: https://wokwi.com/arduino/projects/298685457758159369
How to plot multiple graphs on the same window on Wokwi Arduino simulator?You now know that, when you use Serial.println() the value gets plotted. If you want to multiple graph values, you have to print "\t" to tell the plotter that you are printing more variables.
The actual steps are as follows
use serial.print(plotter_data1); and then use serial.print("\t"); to give a tab.
Now, print the second variable using serial.print(plotter_data2); and then print a tab again using serial.print("\t");
once you are left with only one variable to print, use serial.println(plotter_data3); This is the trick 😃
Below code prints three graphs using the same technique!
void setup() {
Serial.begin(9600);
}
void loop() {
for (int j = 0; j < 360; j=j+2) {
Serial.print(sin(j * (PI / 180)));
Serial.print("\t");
Serial.print(cos(j * (PI / 180)));
Serial.print("\t");
Serial.println(2*cos(j * (PI / 180)));
}
}
Here is how the simulation looks
Here is the link to the project. You can play with the Arduino simulator as well as tinker with the code https://wokwi.com/arduino/projects/322105803627561554
You just have to remember, you will need to separate variables with a tab.
I hope you learnt a good deal about serial plotter on Arduino. If you have questions, please drop a comment!
Here is another example, plotting triangular wave on the serial plotter -
unsigned int period = 1000; // in ms
unsigned int samplingPeriod = 5; // print something every 5ms
double minValue = -1;
double maxValue = 1;
// precalculate some values
double halfPeriod = period / 2.0;
double a1 = (maxValue - minValue) / halfPeriod;
double b1 = 2.0 * maxValue - minValue;
// time management
unsigned long currentTime, relativeTime, previousTime, lastFullPeriod;
void setup() {
Serial.begin(9600);
while (!Serial);
lastFullPeriod = 0;
}
void loop() {
double y;
// check if it is time to display a new value
if (((currentTime = millis()) - previousTime) >= samplingPeriod) {
if ((relativeTime = currentTime - lastFullPeriod) >= period) {
relativeTime = 0 ;
lastFullPeriod = currentTime;
}
if (relativeTime < halfPeriod) {
y = a1 * (double) relativeTime  + minValue;
} else {
y = -a1 * (double) relativeTime + b1 ;
}
//Serial.print(currentTime);
Serial.print("\t");
Serial.println(y, 6);
previousTime = millis();
}
}you have many ways to ask for help, suggest a feature or share your feedback
- Open an issue on GitHub
- Visit Facebook group
- Hop on to Discord Server!
- leave a comment here 😅


Comments
Please log in or sign up to comment.