Nowadays, a combination of light pollution, air pollution and noise pollution has become a great challenge that cannot be neglected for environmental pollution. Hence, more and more environmental parameters are forecasted to facilitate the lives of people. For celebrating the 48th Earth Day, we design a system to monitor the environment of the campus. The considerations are as follows. Firstly, students want to know exactly what it feels like in different locations of campus even when they lie in bed. Secondly, they always want to know the air condition outside before they go out for sports, or for fun. Thirdly, the WiFi hot spots are widely deployed in the campus, which provide good network access condition for our hardware devices.
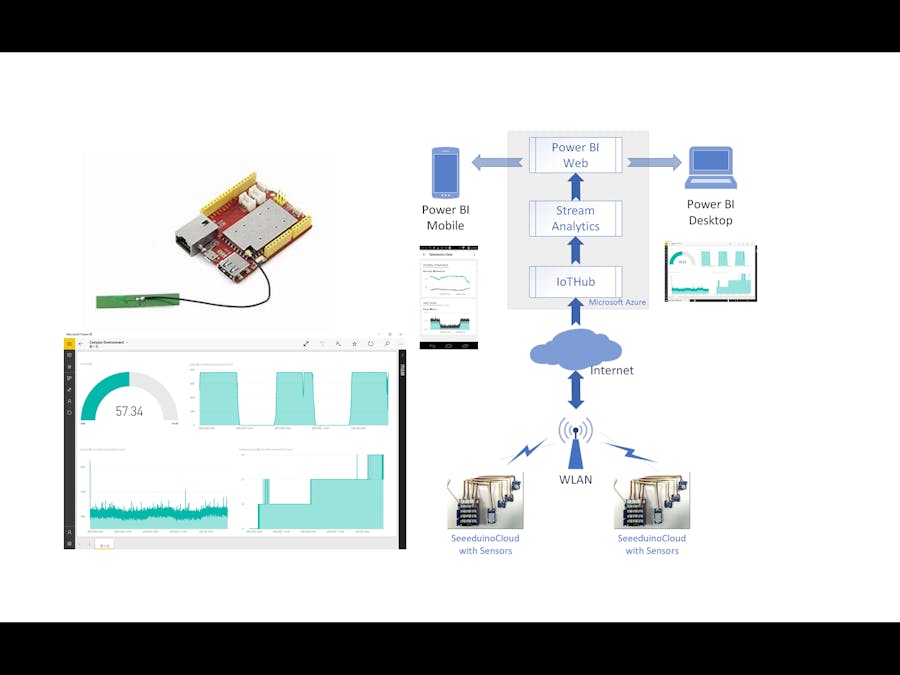
In this project, a campus environmental surveillance system with SeeeduinoCloud and Azure is proposed. Environmental parameters such as temperature, humidity, noise and light are sensed by SeeeduinoCloud, which is a microcontroller board based on Dragino WiFi IoT module HE and ATmega32u4. Then, those environmental data will be transmitted to Azure by IoTHub, which is a cloud service that offers reliable and secure device-to-cloud and cloud-to-device messaging that scales to millions of devices. Next, Azure Stream Analytics will filter the data and send them to Azure Storage Table for data storage, as well as PowerBI for data visualization. The architecture of the proposed system is depicted in Fig.1 as follows.
May 3rd, 2018: Gas sensor is added in. See Power BI Report and source code for more information.
Project VideoSee project video on YouTube as follows.
What You'll NeedIt will take almost 2 hours to complete the project. To successfully run the demo, you need following items:
- SeeeduinoCloud: the more SeeeduinoClouds you have, the more places you can monitor.
- Sensors: Temperature & Humidity Sensor, Light Sensor, Sound Sensor, Gas sensor and Chainable RGB LED.
- Grove Base Shield V2: there are totally 16 grove connectors on the Base Shield.
Time: 5 minutes
Parts: SeeeduinoCloud, Sensors
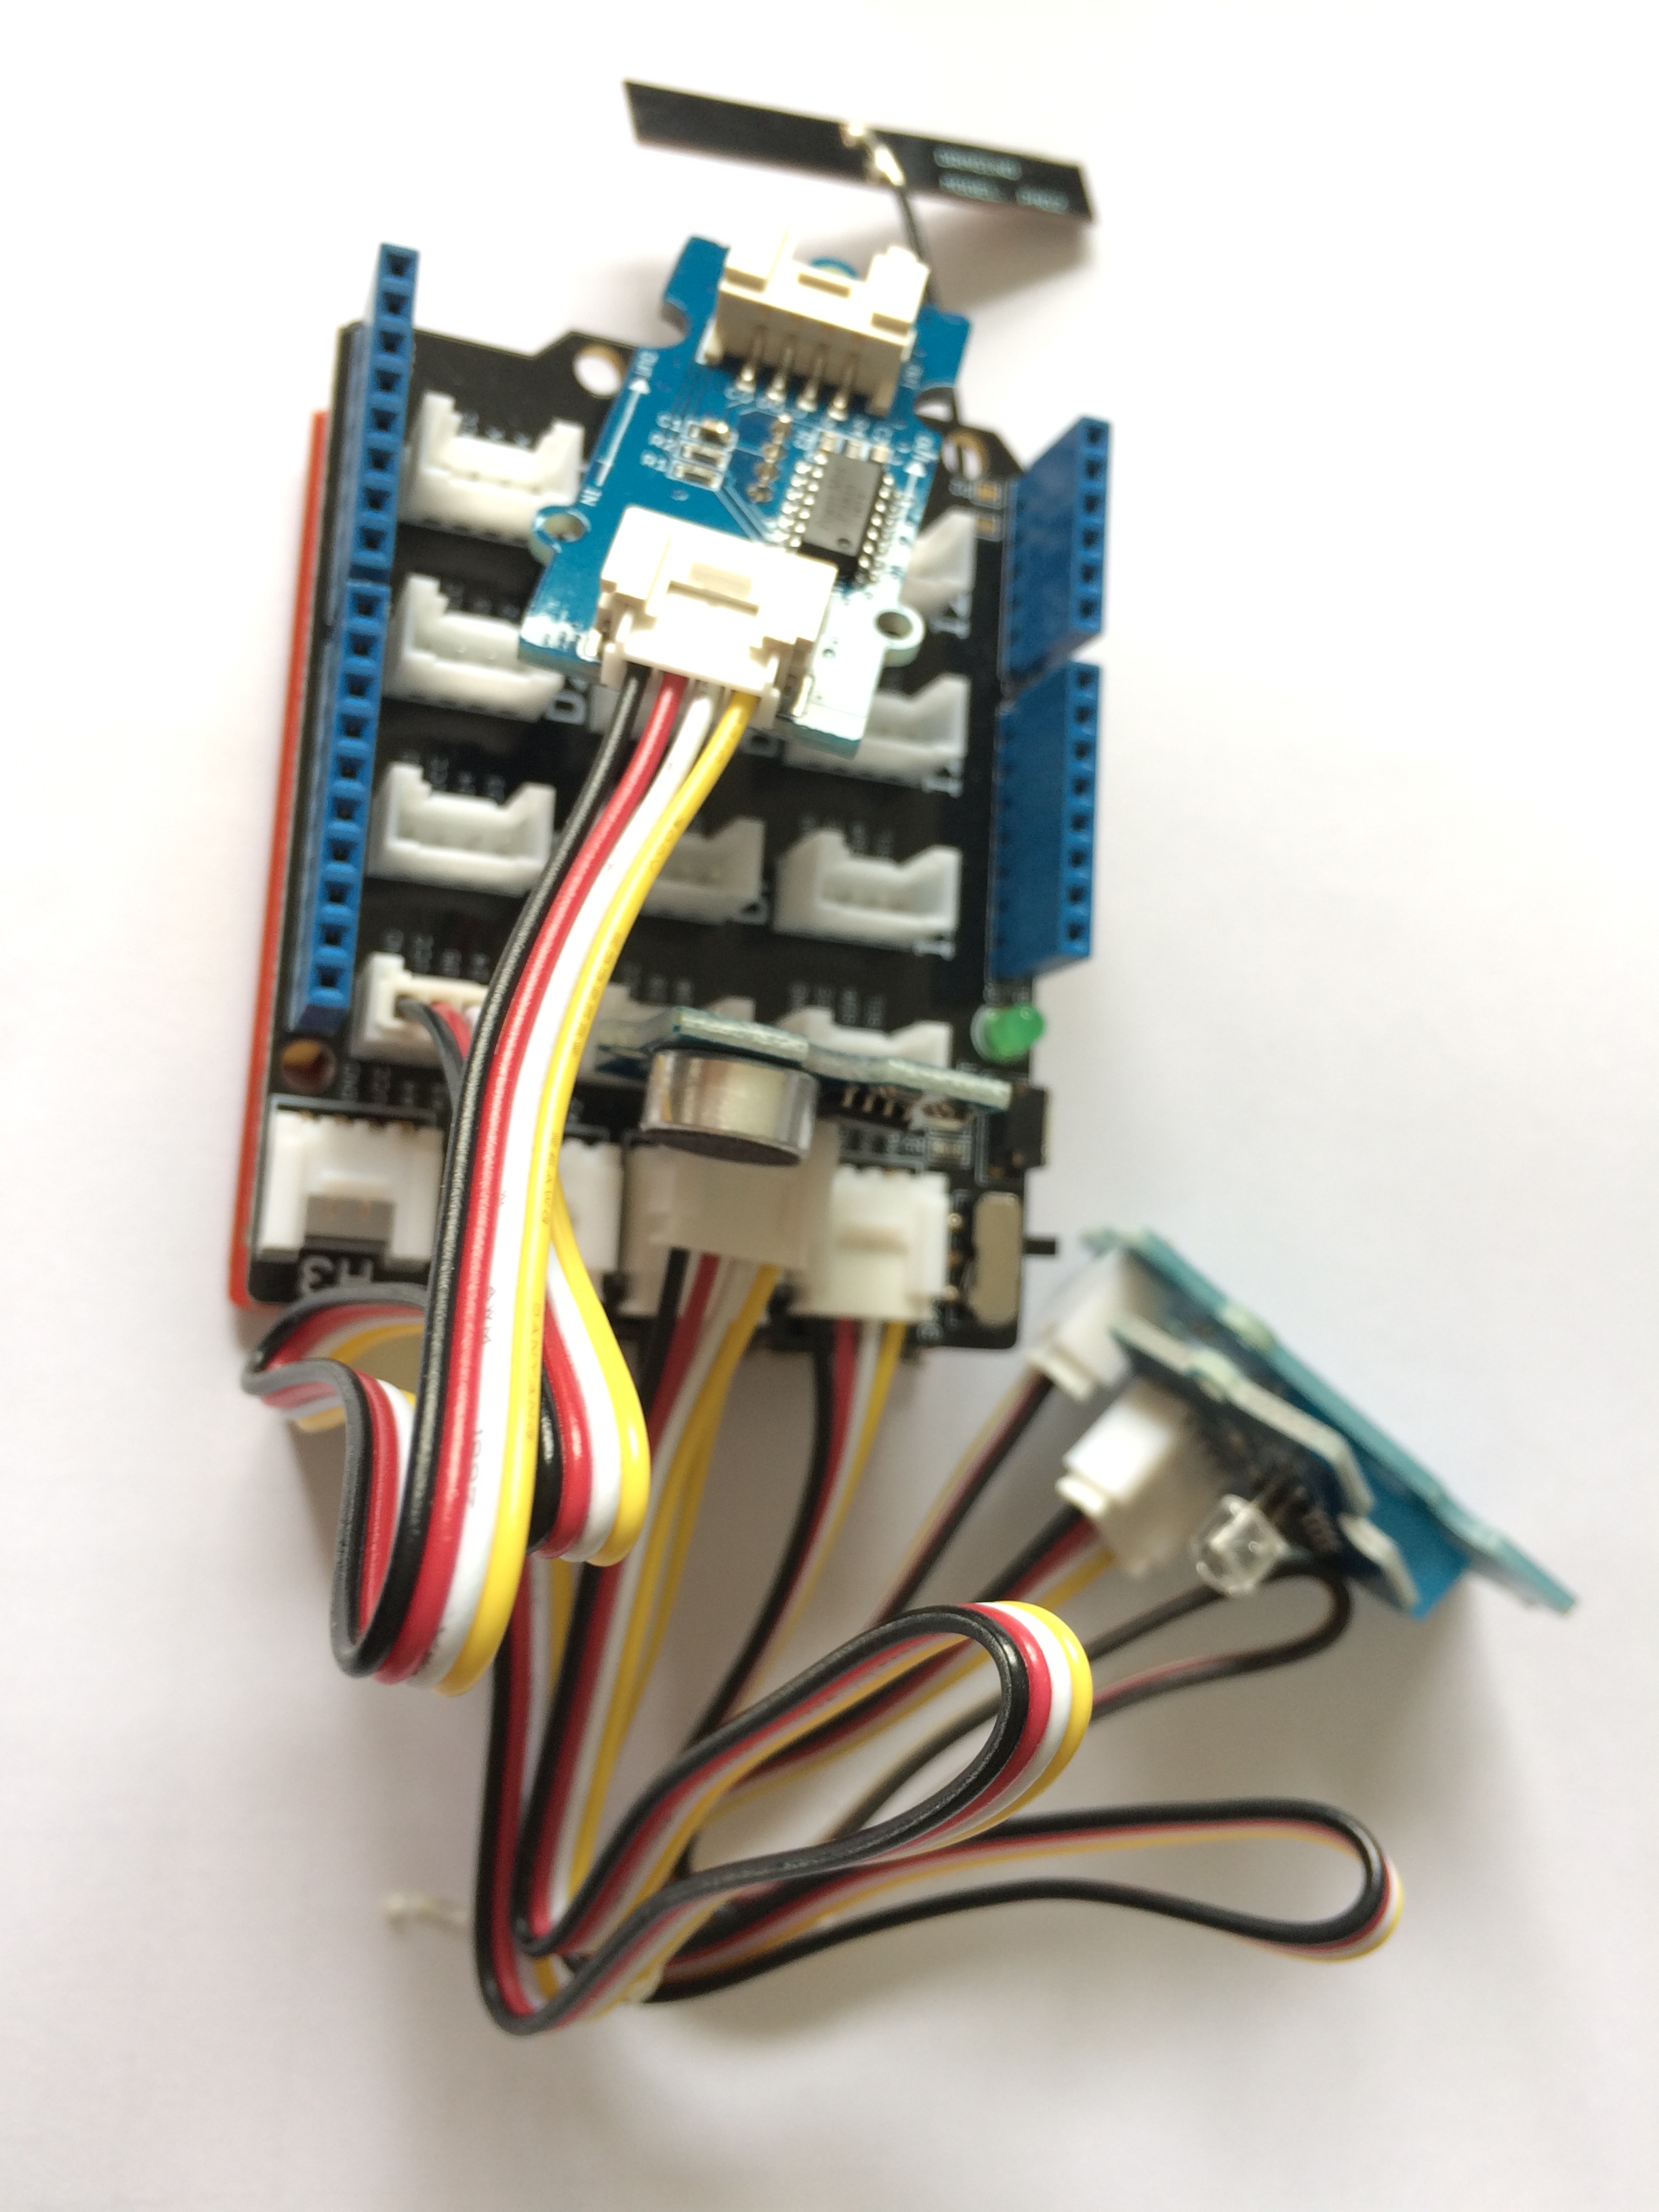
Firstly, connect Temp&Humi Sensor to A0; secondly, connect Light Sensor to A1; thirdly, connect Sound Sensor to A2; lastly connect Chainable RGB LED to D4 & D5. The SeeeduinoCloud with all sensors are shown in Figure 2.
Time: 10 minutes
Parts: Azure Service
IoT Hub service is used to gather all the data that sent from the SeeeduinoCloud. The IoTHub service is created as follows.
- In the Azure Portal (https://portal.azure.com), click the on the "New" icon along the left to see all the services, then click the "Internet of Things" item and choose “IoT Hub”.
- Complete the fields of “Name”, “Pricing Tier”, “IoT Hub Units”, “Device-to-Cloud Partitions”, “Resource group” and “location”, then click the "Create" button. It should be noted that “F1 Free” Pricing is enough for our project. And we’d better choose the local location of the service.
- Wait for the new IoT hub to show as "Online". When it is ready, open the blade of the new IoT hub, take note of the URI and select the key icon at the top to access to the shared access policy settings.
- Select the Shared access policy called iothubowner, and take note of the Primary key and connection string in the right blade. We may copy these into a text file for future use.
For more information, we can refer to this doc online: Create an IoT hub using the Azure portal.
Step 3: Network configurationTime: 15 minutes
Parts: SeeeduinoCloud
When we power ON the Seeeduino Cloud for the first time, there will be an unsecure WiFi network called SeeeduinoCloud-AXXXX shown in wifi connections. We can connect the computer to this network as shown below. The computer will get an IP of this network 192.168.240.xxx. The Seeeduino Cloud has a default IP address of 192.168.240.1.
After connect SeeeduinoCloud, type 172.31.255.254 or 192.168.240.1 in browser search box and we will connect to SeeeduinoCloud with web UI. The default password is "seeeduino", then click LOGIN.
Click "SYSTEM", select the Wi-Fi network, enter the password and click "CONFIGURE & RESTART".
NOTE: The WiFi default mode is AP (Access Point), when finish the configuration it will change to Station mode. It will take almost 30 seconds for SeeeduinoCloud to connect with the WiFi Network.
Step 4: Authenticate the SeeeduinoCloud with Device ExplorerTime: 15 minutes
Parts: SeeeduinoCloud and Device Explorer
Communication between Azure IoTHub and devices is secured. On Windows, we can use Device Explorer app to complete this Authentication process. A pre-built version of the Device Explorer application for Windows can be downloaded by clicking on this link: Downloads (Scroll down for SetupDeviceExplorer.msi). The default installation directory for this application is "C:\Program Files (x86)\Microsoft\DeviceExplorer".
Open the Device Explorer app and fill the IoT Hub Connection String field with the connection string of the IoT Hub that we created in step 2 and click on Update
Go to the Management tab and click on the Create button. The Create Device popup will be displayed. Fill the Device ID field with a new Id for your device (Seeeduino for example) and click on Create as follows.
When the device identity is created, it will be displayed in the grid. Right click on the identity we created, select Copy connection string for selected device and save the value by copying to clipboard, since it will be required to connect the Seeeduino with the IoT Hub.
Time: 10 minutes
Parts: SeeeduinoCloud
Use Putty to connect the SeeeduinoCloud with “root” as username and “seeeduino” as password. See the UI as follows.
Use command “ls” to browse the existing files as follows.
Here we have to modify the AzureConnectionString, as this file stores the Azure IoTHub connection string.
Use vi to key the host name, device id and device key to the file " AzureConnectionString ". The path is " /root/AzureConnectionString."
Step 6: Deploy and run app on SeeeduinoCloudTime: 20 minutes
Parts: SeeeduinoCloud
Download the code from Github, unzip the “Grove ChainableLED” and “Grove Temperature and Humidity Sensor” lib to libraries of Arduino IDE as follows.
Open seeeduino_remote_monitoring.ino with Arduino and Choose “Arduino Yun” in COM Port. Then click upload to download the app to the SeeeduinoCloud as follows.
Use Putty to connect the SeeeduinoCloud with “root” as username and “seeeduino” as password. Use “ps” command to review the process of the device as follows.
Use “./AzureIoTHubClient” command to see the detail information about the message as follows.
Generally, the environmental parameters will be transmitted every 1 second. Here we want to send the message every 30 seconds, so we can modify the delay(1000) to delay(30000) in the loop. Hence, the total message will be 2*60*24=2880 a day, which is under the safe limit of 8000 messages per day for IoTHub-F0.
Furthermore, we can use Device Explorer to monitor the messages of the devices that is registered in the Azure IoTHub. Choose the name of IoTHub and Device ID, click Monitor, all the messages will be displayed on the screen instantly as follows.
Time: 10 minutes
Parts: Azure Service
Azure Stream Analytics is used in this project to filter the sensor data that gathered by IoTHub, and stream the data to PowerBI. The new Stream Analytics is created as follows.
- In the Azure Portal (https://portal.azure.com), click the on the "New" icon along the left to see all the services, then click the "Internet of Things" item and choose “Stream Analytics job”.
- Complete the fields of “Job Name”, “Resource group” and “location”, then click the "Create" button. Wait for the new Stream Analytics to show as "Online".
- Now, it’s time to config the Stream Analytics Job. First, in the Inputs window, we choose IoT Hub, and in the IoT Hub Settings screen, we complete the following information:
- Input Alias: SeeedData
- Subscription: Use IoT Hub from Current Subscription
- Choose an IoT Hub: input the name used during the IoT Hub creation
- IoT Hub Shared Access Policy Name: iothubowner
- IoT Hub Consumer Group: powerbi
- Click Next, and then Complete (leave the Serialization settings as they are).
To set up the output, go to the Stream Analytics Job's OUTPUTS tab, and click the ADD AN OUTPUT link. In the Add an output to your job popup, select the POWER BI option and the click the Next button. In the following screen you will setup the credentials of your Power BI account to allow the job to connect and send data to it. Click the Authorize Now link.
To set up the Query configuration, go to the Stream Analytics Job QUERY tab and replace the query with the following statement:
SELECT
   *
INTO
   [PowerBI]
FROM
   [SeeedData]
It should be noticed that we just select all the data from IoTHub to PowerBI. Click on the SAVE button and YES in the confirmation dialog. Now that the job is configured, the START button is enabled. Click the button to start the job and then select the JOB START TIME option in the START OUTPUT popup. After clicking OK the job will be started. Once the job starts it creates the Power BI datasource associated with the given subscription.
Step 8: Config PowerBI DashboardTime: 20 minutes
Parts: Azure PowerBI service
Now that the datasource is created, go back to Power BI session, and find My Workspace by clicking the Power BI link. After some minutes of the job running you will see that the dataset that you configured as an output for the Job, is now displayed in the Power BI workspace Datasets section.
Please note that the Power BI dataset will only be created if the job is running and if it is receiving data from the IoT Hub input, so check that the SeeeduinoCloud is working and sending data to Azure to ensure that the dataset be created. To check if the Stream Analytics job is receiving and processing data you can check the Azure Management Stream Analytics monitor.
Once the datasource becomes available you can start creating reports. To create a new Report, click on the Power BI datasource.
The Report designer will be opened showing the list of fields available for the selected datasource and the different visualizations supported by the tool. Here we choose Humidity, sound, light and temperature value as Y axis, and measurement time as X axis. Now the report is almost ready. Click the SAVE button and set Campus Environment as the name for the report as follows.
Time: 5 minutes
Parts: Azure PowerBI service
With Power BI Desktop (https://powerbi.microsoft.com/en-us/desktop/), we can get the data from Power BI Web and display the data report that we create above on desktop PC.
With Power BI application on iOS or Android, we can get the data from Power BI Web and display the data report on mobile phone.
In this tutorial, we have achieved the design of campus monitoring system based on SeeeduinoCloud and Azure services. The configurations of Azure Services, including Azure IoTHub, Azure Stream Analytics, and PowerBI are introduced to complete sensor data gathering, data filtering and data visualization.


Comments
Please log in or sign up to comment.