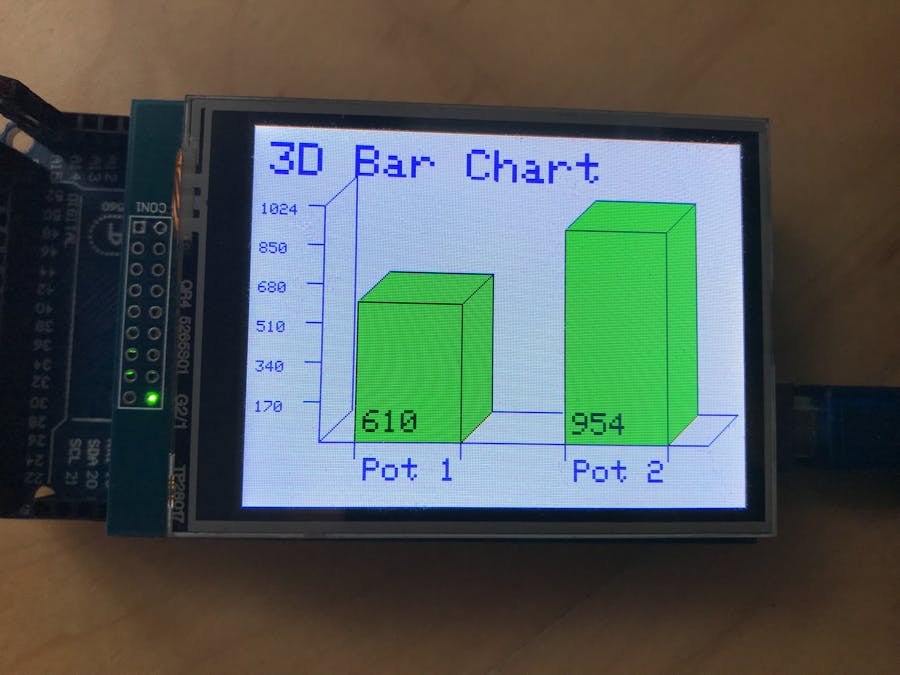
We all use sensors in our projects, collecting data from them and performing tasks with the data, but would it not be nice if we could have a visual representation of this data live?
LCD graphing has been around for some time but the problem is that it is difficult and time consuming to program from scratch. This project aims to make graphing easy and accessible to everyone. A template is provided on which the client can build, and in minutes, you can graph any sensor data live on a beautiful graph.
VideoPhotoThis project builds on the Bar Chart tutorial found here, bringing the third dimension into play. The client has to only edit 2 variables and their graph is ready, the graph's colours can also be personalised with ease, below are some photos with some of the styles you can have the graph in.
The graph will plot the data live as the device reads it, in this example, two potentiometers are used, the device reads their values and then plots them on the graph. Here is a diagram showing the functionality overview.
Below is a diagram with the project's code overview.
Read Sensorswill read the sensors the user attached to the device, the values can be set constant.ProcessDatawill map the sensor data to the graphGraphDatawill draw the graph and graph the data on the LCD.
As the graph is 3 dimensional there are more steps involved in drawing it, the images below guide you through all the steps taken to draw the graph.
All you have to know to be able to proceed with this project is a broad understanding onto how things are positioned on the TFT LCD, this is explained below.
I refer to the whole LCD as the canvas, this is where everything is drawn, all TFT LCD libraries work quite similarly, so the functions in this code should also work with other libraries. Below is a sketch of a quadrilateral (a rectangle) being drawn on a TFT LCD.
Sketch of Shape
In this sketch, a rectangle is drawn, each point is labelled, the line of code that is used to draw a rectangle is this,
tft.fillRect(originX, originY, sizeX, sizeY, Colour);
originXis represented by 'z' on the diagram above, this is the distance from the right of the screen to the shape.originYis represented by 'x' on the sketch, this is the distance form the top of the screen to the shape.sizeXis the size of the shape on the x axis, this is the length of the shape.sizeYis the size of the shape on the y axis, this is the height of the shape.
Theuseroperatingthisprojectwillbenefitin:
- Graphing their data on a professional graph in minutes
- Ability to personalise the graph
- Ease of set up
Step1: Required Apparatus
This example uses potentiometers as the sensors from which we will gather the data but any sensors, digital or analogue can be used. The list of materials is below.
- 1, Arduino Mega
- 1, Elegoo 2.8' TFT LCD
- 1, Breadboard
- 2, Potentiometers
- Jumper Wires
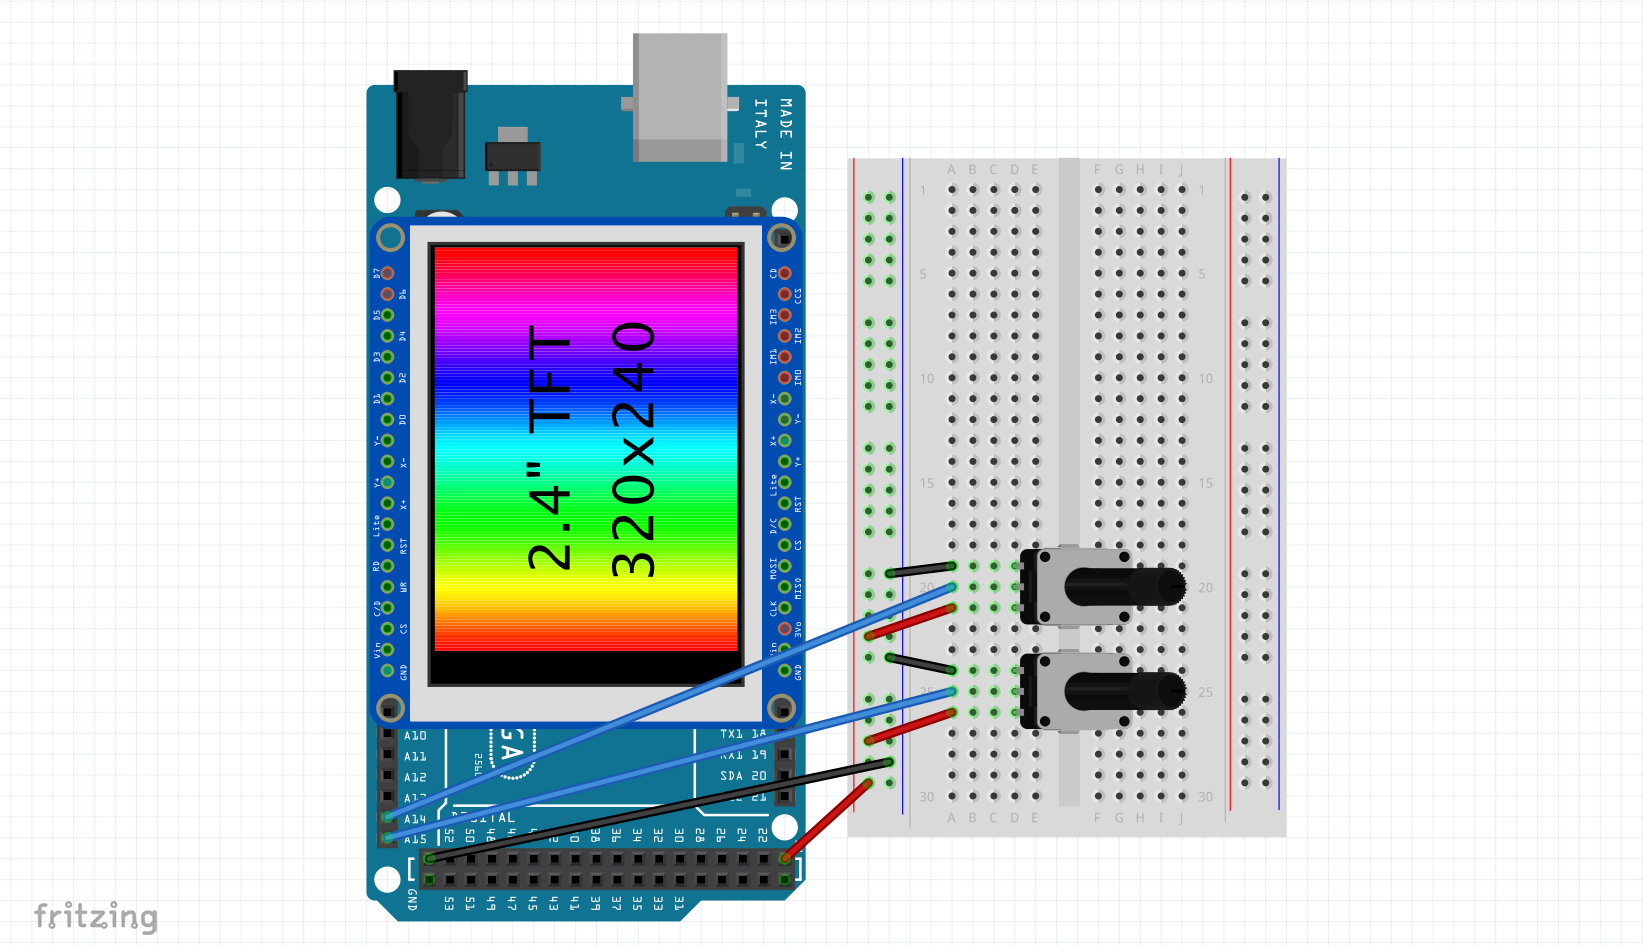
Step2:Connecting the Circuit
The schematics below show how the circuit is wired, just snap on the TFT LCD and connect the potentiometers.
Step 3: Acknowledging the Code
There are three main parts to the code:
- Set Up Graph
- Read Sensor Values
- Draw Graph
These sections are explained below.
- Set Up Graph
// draw title
 tft.setCursor(10, 10); // set the cursor
 tft.setTextColor(BLUE); // set the colour of the text
 tft.setTextSize(3); // set the size of the text
 tft.println(graphName);
 // draw outline
 tft.drawLine(originX, originY, ((originX + sizeX) - 20), originY, graphColor);
 tft.drawLine(originX, originY, originX, (originY - sizeY), graphColor);
 tft.drawLine(originX, originY, (originX + 20), (originY - 20), graphColor);
 tft.drawLine(((originX + sizeX) - 20), originY, ((originX + sizeX)), (originY - 20), graphColor);
 tft.drawLine((originX + 20), (originY - 20), (originX + 20), ((originY - sizeY) - 20), graphColor);
 tft.drawLine((originX + 20), ((originY - sizeY) - 20), originX, (originY - sizeY), graphColor);
 tft.drawLine((originX + 20), (originY - 20), ((originX + sizeX)), (originY - 20), graphColor);
 // draw lables
 for(int i = 0; i < numberOfMarks; i++)
 {
   tft.drawLine(mark[i], originY, mark[i], minorSizeY, graphColor);
 }
 // draw lable names
 for(int i = 0; i < numberOfMarks; i += 2)
 {
   tft.setCursor((mark[i] + 6), (originY + 10));
   tft.setTextColor(graphColor);
   tft.setTextSize(2);
   tft.println(graphBlock[i / 2]);
 }
 // draw numbers
 for(int i = 0; i < 6; i++)
 {
   tft.drawLine(originX, (originY - number[i]), minorSizeX, (originY - number[i]), graphColor);
 }
 // draw number values
 for(int i = 0; i < 6; i++)
 {
   tft.setCursor((minorSizeX - 30), (number[i] + numberSize));
   tft.setTextColor(graphColor);
   tft.setTextSize(1);
   tft.println(val[i]);
 }
This section of code draws the outline of the graph and gives it a 3D effect. This is done using the parameters set by the user.
- Read Sensor Data
// get the values of the sensors
 valueBlock[0] = analogRead(A15);
 valueBlock[1] = analogRead(A14);
This section of code will append 2 analog values to the variables representing the data that will be used to draw the graph.
- DrawGraph
// Erase the previous blocks
 for(int i = 0; i < 2; i++)
 {
   if(posBlock[i] > (prevPosBlock[i] + 2) || posBlock[i] < (prevPosBlock[i] - 2) || firstRun)
   {
     tft.fillRect((mark[i * 2] - 1), ((originY - sizeY) - 20), (boxSize + 22), (sizeY + 20), WHITE);
   }
 }
 // Complicated graph redrawing
 if(valueBlock[0] < 5)
 {
   tft.drawLine((originX + 20), (originY - 20), ((originX + sizeX) / 2), (originY - 20), graphColor);
 }
 if(valueBlock[1] < 5)
 {
   tft.drawLine((((originX + 20) * 2) + 25), (originY - 20), ((originX + sizeX)), (originY - 20), graphColor);
 }
 // The main graph drawing loop
 for(int i = 0; i < 2; i++)
 {
   if(posBlock[i] > (prevPosBlock[i] + 2) || posBlock[i] < (prevPosBlock[i] - 2) || firstRun)
   {
     // start drawing
     tft.drawLine((mark[(i * 2) + 1]), originY, (mark[(i * 2) + 1] + 20), (originY - 20), BLACK);
     tft.drawLine((mark[(i * 2)] + 20), (posBlock[i] - 20), mark[(i * 2)], posBlock[i], BLACK);
     if(valueBlock[i] > 20)
     {
       // draw the bars
       tft.fillRect((mark[i * 2] + 1), (posBlock[i] + 1), (boxSize - 1), (originY - posBlock[i] - 1), blockColor);
       // Draw 3D Outline
       tft.drawLine((mark[(i * 2) + 1] + 20), (originY - 20), (mark[(i * 2) + 1] + 20), (posBlock[i] - 20), BLACK);
       tft.drawLine((mark[(i * 2) + 1] + 20), (posBlock[i] - 20), mark[(i * 2) + 1], posBlock[i], BLACK);
       tft.drawLine((mark[(i * 2)] + 20), (posBlock[i] - 20), (mark[(i * 2) + 1] + 20), (posBlock[i] - 20), BLACK);
       tft.drawLine(mark[(i * 2)], posBlock[i], (mark[(i * 2) + 1]), posBlock[i], BLACK);
       tft.drawLine(mark[(i * 2)], originY, mark[(i * 2)], posBlock[i], BLACK);
       tft.drawLine(mark[(i * 2) + 1], originY, mark[(i * 2) + 1], posBlock[i], BLACK);
       // Draw the triangles
       tft.fillTriangle((mark[(i * 2) + 1] + 1), (originY - 2), ((mark[(i * 2) + 1] + 20) - 1), ((originY - 20) - 1), ((mark[(i * 2) + 1] + 20) - 1), ((posBlock[i] - 20) + 2), blockColor);
       tft.fillTriangle((mark[(i * 2) + 1] + 1), posBlock[i], (mark[(i * 2) + 1] + 1), (originY - 2), ((mark[(i * 2) + 1] + 20) - 1), ((posBlock[i] - 20) + 2), blockColor);
       tft.fillTriangle((mark[(i * 2) + 1]), (posBlock[i] - 1), ((mark[(i * 2) + 1] + 20) - 2), ((posBlock[i] - 20) + 1), (mark[(i * 2)] + 2), (posBlock[i] - 1), blockColor);
       tft.fillTriangle((mark[(i * 2)] + 1), (posBlock[i] - 1), ((mark[(i * 2) + 1] + 20) - 2), ((posBlock[i] - 20) + 1), ((mark[(i * 2)] + 20)), ((posBlock[i] - 20) + 1), blockColor);
     }
   }
 }
 // print value on bars if set
 for(int i = 0; i < 2; i++)
 {
   if(posBlock[i] > (prevPosBlock[i] + 2) || posBlock[i] < (prevPosBlock[i] - 2) || firstRun)
   {
     prevPosBlock[i] = posBlock[i];
     if(displayValues)
     {
       tft.setCursor((mark[i * 2] + 5), (originY - 20));
       tft.setTextColor(BLACK);
       tft.setTextSize(2);
       tft.println(valueBlock[(i *2) / 2]);
     }
   }
 }
 firstRun = false;
This part of code will draw the bars of the graph representing the sensor data collected, fro further information on the exact procedure, refer to Functionality > Drawing the Graph.
Personalising the Graph
So that is great, we have the graph, but it is always nicer to be able to make it our own, here we will talk about personalising the graph. The lines of code below expose the variables that have to be edited.
bool proDebug = false;                              // TODO - Debugging? ~ true/false - Note - Requires Serial Monitor to be open
 bool displayValues = true;                          // TODO - Display the Values of the Sensors on the Graph?
 uint16_t graphColor = BLUE;                         // TODO - Colour of Graph Outline
 uint16_t blockColor = GREEN;                        // TODO - Colour of Bars
 String graphName = "3D Bar Chart";                  // TODO - Title of Graph
 String graphBlock[] = {"Pot 1", "Pot 2"};           // TODO - Title of Blocks
 int graphRange = 1024;                              // Max Value that the data can get to - Used to map the data - Refer to Tutorial for help setting
proDebugenables printing to the serial monitor, its default position is 0 (off), when turned on (1/true), the device requires the serial monitor to be open, it then prints values to the serial monitor, ideal for troubleshooting.displayValuesregulates if values should be displayed for each bar or not, when turned on, the value of each sensor is displayed at the bottom of each block, defaults to true.graphColorsets the colour of the graph, the lines and numbers on the x and y axis will be displayed in the selected colour.blockColoursets the colour that the blocks/bars of the chart are displayed in.graphNamesets the name of the chart, this is displayed at the top of the graph in blue.graphRangeis the highest number that the sensor can output, this number is essential for the graphing and must be set correctly, if you want to display a Raw Analog pin's value, like the potentiometer, set it to 1024, the max value of an Analog pin. If you are using a sensor that outputs a gestured value, like a temperature sensor, you could set the value to a high number like 50. (Note that the chart has not been tested with negative numbers)
All of the other values are calculated automatically which means less time to worry about the code and more time to enjoy the graph.
Editing Values
As mentioned so many times before, the project can graph any data you give it. At the moment the code is designed to read Analogue pins 14 and 15 and graph those values, but the user can read any analogue pins connected to any sensors and even integrate libraries in the code that provide the data. Adding your own value to the graph is stepped below.
Going Further
You can go further experimenting with the project, try editing the originX, originY, sizeX and sizeY constants to give your graph a different size and position on the screen. There is a header file attached to the main sketch, it contains the colour codes of some colours, try changing the colour of the chart and the bars. And that is it, your personalised graph is ready.
Libraries
- Elegoo Libraries - Copyright (c) 2012 Adafruit Industries under the BSD License
I have been thinking of building this project after I have published the original Bar Chart project that you can find here. Basically building on that project and making it 3D. It unfortunately is not possible to edit the amount of bars in the chart as the 3D parts of the graph may not look so realistic.
Well I got the time to make it now and here it is. Giving everyone the ability to display their data in style, in 3D locally on a TFT LCD, so there is no need to parse the data to a backend and display it there.


_wzec989qrF.jpg?auto=compress%2Cformat&w=48&h=48&fit=fill&bg=ffffff)


Comments
Please log in or sign up to comment.