At the beginning, we talk a little about the hardware. We use the DHT11 sensor to measure temperature and humidity, and the MQ-7 sensor to measure the amount of carbon monoxide (CO) gas in the environment in terms of PPM. The connection and wiring of Raspberry Pi pico w microcontroller and sensors is as described in the schematic below. This schematic is designed in Altium Designer software.
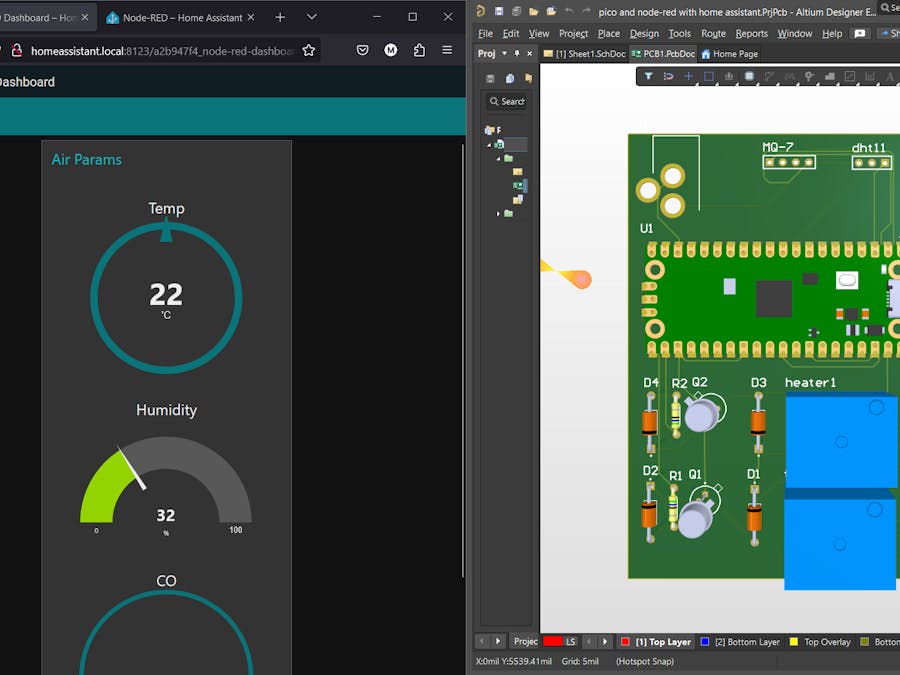
As you can see in the circuit above, I have also designed two circuits for output relays related to heater and fan control, but I did not use relays in the prototype and testing part of this project. Also, I did not define the output pins of the relay in the programming section. But according to your taste and needs, you can also upgrade this circuit and system program and add more features to it. Also try using a 5V 2A adapter to power this circuit. As we all know, a relay cannot be activated or deactivated directly through the microcontroller, and a transistor or optocoupler trigger circuit must be used. In the above schematic, I used the simplest transistor circuit to set up two relays. In the following, you can see the PCB board of the above circuit, which, if needed, you can use this circuit to print and assemble the final system.
We come to discussions related to programming. First of all, we will talk about the program that is going to run on the Raspberry Pi Pico microcontroller. The following program connects to our WiFi modem at the beginning of the work. After defining the Wi-Fi network for the microcontroller, we define the pins associated with each sensor. The DHT11 sensor is connected to the GPIO15 pin of the microcontroller and the MQ-7 sensor is connected to the analog pin of the microcontroller (GPIO26) and after defining the pins, we define a function called air_params. This function calculates all parameters of temperature, humidity and carbon monoxide gas and returns it to us in its output. Before entering the program loop, we define the url variable. This url is the IP address of the Raspberry Pi single-board computer and the Home Assistant operating system. Now we enter a circle. In this loop, we read all the parameters from the air_params function and store them in a dictionary named sensor_data so that we can send this information in json format to Node-RED. And if we encounter a problem in sending information, all relevant errors will be displayed in the Except section. The complete microcontroller program in Micro Python is as follows:
import network
import urequests
import ujson
from machine import Pin, ADC
import dht
from time import sleep
dht_sensor = dht.DHT11(Pin(15))
analog_value = ADC(Pin(26))
# Connect to Wi-Fi
wlan = network.WLAN(network.STA_IF)
wlan.active(True)
wlan.connect('Mrsh77', '1m77n2299215r77#')
# Wait for connection
while not wlan.isconnected():
pass
def air_params():
#sleep(2)
dht_sensor.measure()
temp = dht_sensor.temperature()
hum = dht_sensor.humidity()
CO_value = analog_value.read_u16()
return temp, hum, CO_value
# Define the URL and the message
url = 'http://192.168.1.232:1880/endpoint/data'
while True:
try:
temperature, humidity, co = air_params()
#print(temperature, humidity, co)
sensor_data = {
"temperature" : temperature,
"humudity" : humidity,
"co" : co
}
json_data = ujson.dumps(sensor_data)
response = urequests.post(url, data=json_data)
#print(response.text)
sleep(2)
except Exception as e:
print("there is a problem: ",e)
sleep(2)
Now, to get information in Node-RED and Home Assistant, we follow the block diagram below. This block diagram (program) receives all microcontroller data in json format through the http in block, and with the help of two functions, it first converts the json data into an integer and separates all three and displays them separately. Also, we must pay attention to connect the http response block to the http in block. If we do not do this, Node-RED will receive the data only once and will not receive the microcontroller data consecutively in a loop. The block diagram of the program written in Node-Red is as shown in the following image.
You can also use the json script at the end of this article to copy the block diagram of the Node-RED program.
After all the above steps, you can easily view the parameters received from the microcontroller (temperature, humidity and carbon monoxide gas) through the Node-RED dashboard and Home Assistant.
I hope you enjoyed this project and many ideas came to your mind. You can see the full video of the project below. And at the end of this article, you can download the documents related to this project.


Comments
Please log in or sign up to comment.