


Hardware components | ||||||
_ztBMuBhMHo.jpg?auto=compress%2Cformat&w=48&h=48&fit=fill&bg=ffffff) |
| × | 1 | |||
 |
| × | 1 | |||
| × | 1 | ||||
| × | 1 | ||||
 |
| × | 1 | |||
 |
| × | 1 | |||
Software apps and online services | ||||||
 |
| |||||
 |
| |||||
 |
| |||||
The following is an Arduino UNO based project that is suppose to calculate SPO2, Heart rate and monitor ECG of a patient. It uses the MAX30100 pulse oximeter and AD8232 ECG sensor module. SPO2 and heart rate is displayed on the 0.91" inch OLED display. And the ECG readings are analyzed and posted on ThingSpeak website. This project requires knowledge of Arduino IDE and Matlab for better understanding.
This is a good entry level project to work on if you wish to learn how to take data from an Arduino and then use Matlab for data analysis.
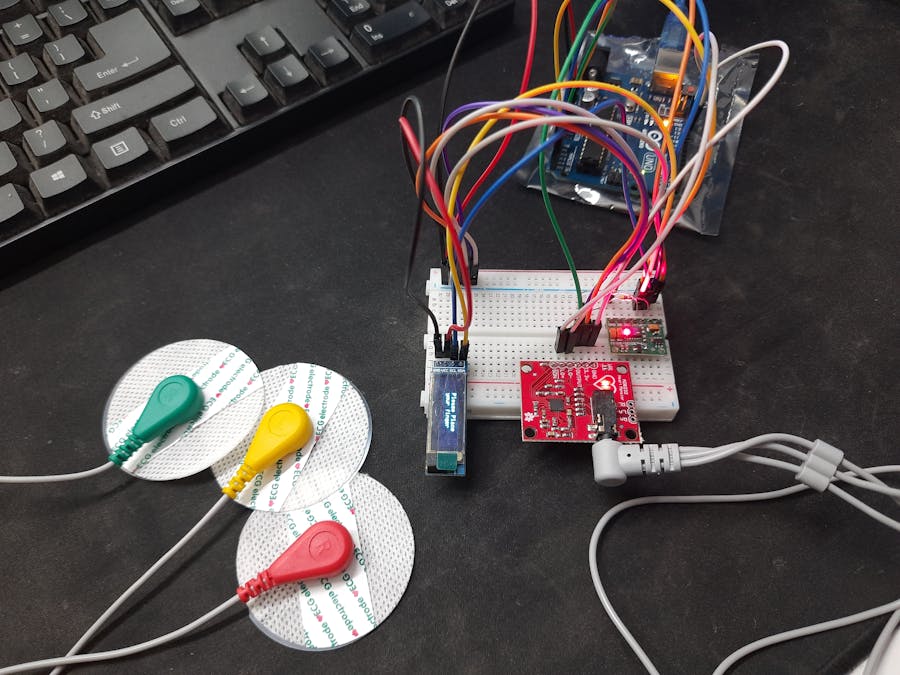
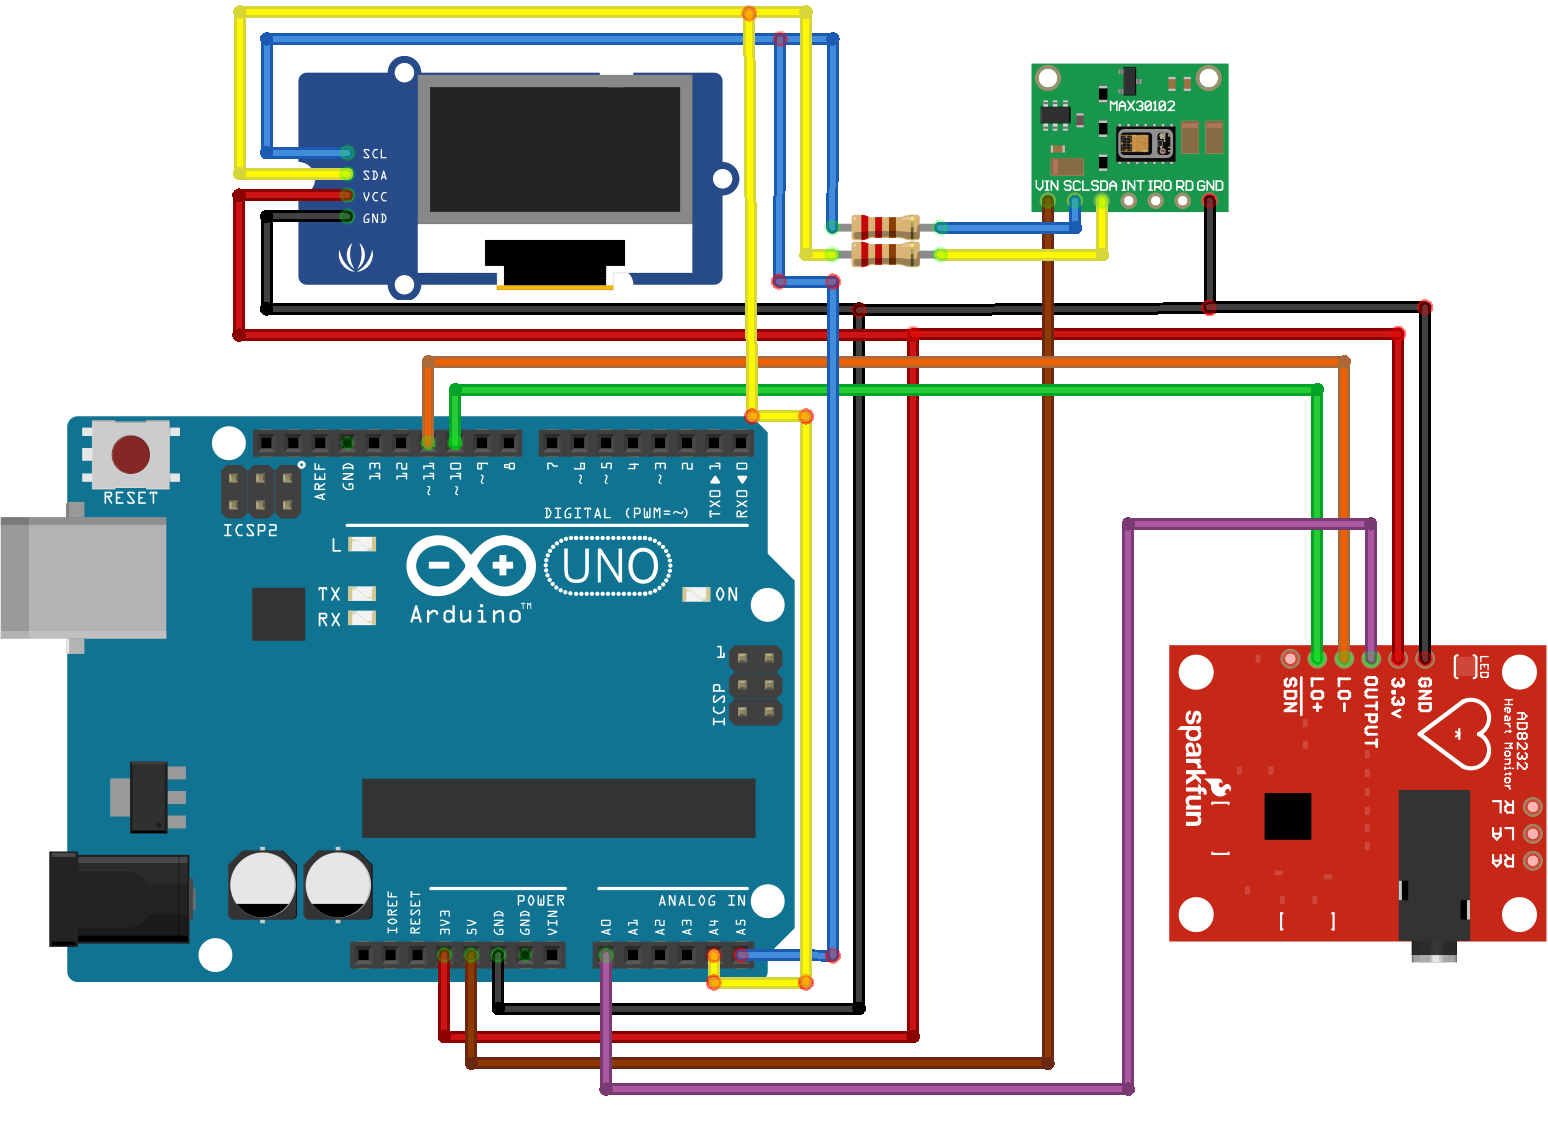
Sensors UsedMAX30100 pulse oximeter
MAX30100 Pulse Oximeter Heart Rate Sensor Module carries Maxim’s MAX30100 integrated pulse oximetry and a heart-rate sensor. It’s an optical sensor that derives its readings from emitting two wavelengths of light from two LEDs – a red and an infrared one – then measuring the absorbance of pulsing blood through a photodetector. This particular LED color combination is optimized for reading the data through the tip of one’s finger.
AD8232 ECG Sensor
This Heart Rate Monitor Kit With AD8232 ECG Sensor Module is used to measure the electrical activity of the heart. This electrical activity can be charted as an ECG or Electrocardiogram and output as an analog reading.
ECGs can be extremely noisy, The Heart Rate Monitor Kit With AD8232 ECG Sensor Module acts as an op amp to help obtain a clear signal from the PR and QT Intervals easily. The AD8232 is an integrated signal conditioning block for ECG and other biopotential measurement applications. It is designed to extract, amplify, and filter small bio potential signals in the presence of noisy conditions, such as those created by motion or remote electrode placement.
Arduino IDE (libraries needed)
The project requires libraries for OLED display and MAX30100 sensor:
OLED display:
Adafruit SSD1306 - Arduino Reference
Adafruit GFX Library - Arduino Reference
MAX30100:
MAX30100lib - Arduino Reference
Basic working of code
The setup function initializes the OLED display and MAX30100 sensor. The current for RED LED of the MAX30100 sensor is set to 7.6 ma. However based on the sensitivity required these values can be changed by changing the value of RED_LED_CURRENT. See MAX30100_Rawdata example for more details.
Initially the display reads "Please place your finger". Now, in order to detect the finger, IR readings from the sensor are used. The irValue variable stores the IR values from the sensor, if this value is below 7000, then that means their is currently no finger placed on to the senor. Once the finger is detected the respective SPO2 and HR readings are shown on the display. The function pox.getHeartRate() is used to get the heart rate readings, and pox.getSpO2() is used to get the SPO2 readings. Another function onBeatDetected() is used to show the readings as well as display the bmp graphic of the heart on the side. Refer to MAX30100_Minimal example for better understanding of the code.
UseofMatlab
Before running the Matlab code make sure you have Signal Processing Toolbox, Wavelet Toolbox and the Arduino Package for Matlabis installed.
Matlab is used in the following project to demonstrate how an ECG signal can be obtained from the Arduino and further used for any mathematical analysis. As a demonstration I have worked on a short program that can graph the R wave of the raw ECG signal obtained, using which one can easily calculate the heart rate. These readings are then sent to a website called ThingSpaeak. ThingSpeak is an IoT analytics platform service that allows users to aggregate, visualize, and analyze live data streams in the cloud.
Another interesting way that Matlab can be used in this project is to filter a noisy ECG signal. Although this method is not needed in this project as the sensor used comes with an on board op amp to help filter the noise. However, if you are interested to know more about ECG signal filtering via Matlab then I would suggest this article "Implement Notch Filter to remove 50 Hz on ECG signal - File Exchange - MATLAB Central (mathworks.com)". Another method of filtering can be seen from this article " Removing High-Frequency Noise from an ECG Signal - MATLAB & Simulink - MathWorks India ".
The Matlab data collected is sent to a ThingSpeak website where further analysis can be made. In this project, I have worked on 4 simple program that you can run on ThingSpeak to visualize the ECG data in 4 ways. The first program is a simply plots the ECG signal. Second program is to plot the R-R intervals. Third program shows the frequency response of the ECG signal, this is helpful to detect noise in your signal. The last program shows the PSD (power spectral density) of signal, again helpful in verifying the integrity of the signal received.
Note: The following graphs are made from sampledata and not via AD8232sensor.
In order to learn how to use ThingSpeak with Matlab I would highly recommend this webinar.
Hardware AspectsMAX30100 problems:
There are two types of MAX30100 pulse oximeter sensor available in the market. If you have the purple one (GY-MAX30100) like shown in the figure then you don't have to worry about anything. However, if you have the green one which is used here, then you will haveto remove the onboard 472 ohm resistors and use an external 4.7K ohm resistors to SCL and SDA pinsasshownintheschematic.
Further, if you wish to use the MAX30102 Heart Rate sensor (black), then make sure you have a much more powerful microcontroller like an Arduino Mega. This sensor needs more space for its oximeter libraries because of which, using an OLED display and the sensor together on the Arduino UNO board causes stability issues. You can still use this senor to display the heart rate as the libraries required for that are much smaller in size.
PrototypeThe final prototype was made on the breadboard:
ECG
As you can see the filter is not really needed for the AD8232 sensor. However, the filter program is also attached for better understanding.
The following video shows some data visualization via MATLAB using sample data.
SPO2
Onemorething: This is the first Arduino project where I have tried to do work on something a little more complex. If you have any feedbacks then that would be much appreciated.


_3u05Tpwasz.png?auto=compress%2Cformat&w=40&h=40&fit=fillmax&bg=fff&dpr=2)
Comments
Please log in or sign up to comment.