Coronavirus disease, also known as COVID-19, is an infectious disease which spreads between humans. The incubation period of coronavirus is on average 5 - 6 days, but it could also be up to 14 days. During this incubation period, before the person begins experiencing symptoms, the person could be contagious. The virus would spread to the people with whom the infected person is interacting, and this is dangerous. The presence of coronavirus in a human's body could be tested by carrying out PCR tests. The demand for PCR tests is increasing, but the tests cannot be carried everywhere.
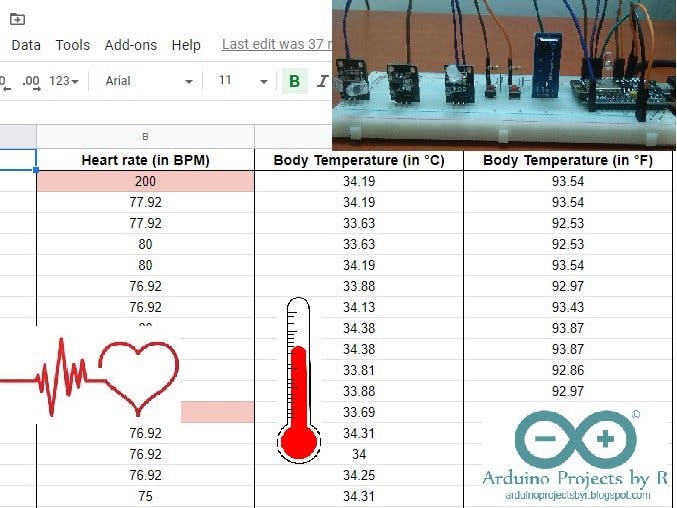
Fever is a common symptom of coronavirus disease. Studies have shown that this disease could also accelerate heart rate. In my project, the body temperature and heart rate will be measured and data logged in google sheets with the help of pushingbox online service. The spreadsheet can then be shared with your doctor.
Actually, I planned to do this project with GY-906 MLX90614ESF Infrared Temperature (Non-contact) Sensor Module and MAX30100/02 High sensitivity Pulse Oximeter to get more accurate and reliable results, but I could not go out due to the lockdown in my country. I tried to order them online, but the shipment is pending at the moment, so I decided to use the components I had at home. I would recommend you to use those two sensors instead of the DS18B20 temperature sensor module and heartbeat sensor module.
Aim/ Objective of this projectThe aim of this project is to take remote health measurements and share them with the doctor so that he/ she can monitor them from anywhere at anytime. This system could also be used in particular areas or remote villages where people could log their health measurements. If anyone's health measurement is abnormal - out of range or higher than a critical value - the doctor could notify the health care workers in the particular area to carry out PCR tests for the particular cluster or the people living there.
This system costs around $30 and is easy to build. It is also an open source remote monitoring system and would help many medical personnels and people worldwide.
How does this work?This system could be made into a medical device and used to record the health measurements of the people living in remote areas or villages. The people in a particular area will record their health measurements. The date and time will also be recorded. Before taking their health measurements, however, the person must practice hand hygiene - wash hands for at least 20 seconds. A touchless faucet (https://www.hackster.io/RUCKSIKAA/automatic-faucet-touchless-using-arduino-for-covid-19-369b18) could be used for this purpose. A medical personnel could be present in the place of testing to guide the people.
After the person washes his/ her hands, the health care worker will press the push-button allocated for the body temperature measurements. The non-contact temperature sensor module will be used to take body temperature measurements of the person. After the measurement is taken, press the push-button again to record it. If the temperature is above 37°C, the person will be immediately sent for PCR testing.
If the temperature is not above the critical value (37°C), he/ she can proceed to measure the heart rate. Before measuring the heart rate, the second push-button must be pressed. Measuring heart rate would require the person to place his/ her finger on the sensor as the measurements are taken by reflective method. The person's hand must be clean as the sensor module will be shared among others as well. This is the reason why the person must practice hand hygiene - the virus could spread to the next person who uses the sensor if this person's hands are contaminated. If the heartbeat is detected, the normal LED will light up. While the heart rate measurements are being taken, the two-colour LED module will be green in colour. The LED will turn red while the body temperature is recorded. As I have already mentioned, the push-button should be pressed again to record the measurements.
After the health measurements are taken, the health care worker can hover his/ her finger over the IR tracking sensor. This will make a request to the Pushingbox API which converts the HTTP transmitted data into Google compliant HTTPS encrypted data. The measurements will be logged in the Google sheets. If the temperature exceeds 37°C, the cell will turn red - due to conditional formatting. This will also happen if the heart rate is above the average heart rate. If the person has heart conditions, his/ her heart rate will be compared to previous measurements. This practice will make it easier for the doctor to detect COVID-19 patients in remote areas or villages.
This remote monitoring system could also be used at homes where elderly people can take their health measurements by themselves and share the spreadsheet with their doctor. By following this practice, the people do not have to travel to the hospitals or go out to take their health measurements.
How to make this remote monitoring systemStep 01: Creating your Google sheet
- Log in to your Gmail account, or sign up if you do not have one - creating a Gmail account is totally free.
- Go to Google sheets and create a new spreadsheet.
- Copy and save your spreadsheet's URL key - found in the URL between
docs.google.com/spreadsheets/d/and/edit#gid=0. - Create four columns and name them as Date and Time, Heart rate (in BPM), Body Temperature (in °C) and Body Temperature (in °F).
- Set the cell format as Date and Time for all cells in column A.
- You have to use conditional formatting for column C and D so that the cell will be highlighted as red when the body temperature measurement exceeds 37 and 98.6, respectively.
- For column B, the cell should be highlighted as red when the heart rate measurement is out of range or above the average heart rate (in BPM).
- Share this spreadsheet with your doctor or by sending him/ her the sharing link of the spreadsheet.
Step 02: Deploying your Google sheet as a web app
- To deploy your Google sheet, you must create a Google App script.
- To create a Google App script, go to Tools and select 'Script Editor'.
- The script will be blank initially and you can copy the code which I have included in the Code section below.
- Do not forget to include the Spreadsheet's URL key in the codes.
- Save the script by going to File menu and selecting Save All.
- Deploy your Google script as a web app by going to Publish menu and selecting Deploy as web app...
You will need to copy and save the current web app URL for later purposes.
Step 03: Setting up Pushingbox
Pushingbox is a free and easy-to-use API (Application programming interface) which will help you to communicate between your microcontroller and Google sheets. Your microcontroller will make an API request to this service for the communication to happen. To make this project possible, you have to configure the Pushingbox API. You have to create a service and then a scenario to make this project work. You are given up to 100 free requests per day, and this means that you can take health measurements for approximately 100 people everyday.
Follow the procedures below to configure the Pushingbox API and make this project work like you expected.
- You will need to log in to Pushingbox using your Gmail account.
- After you log in, you will see your dashboard.
Create a service
- Click on MyServices and select Add a service.
- You will see a number of options below and you have to choose CustomURL.
- Select this service and fill in the form.
- You have to paste your web app URL in the Root URL option.
- Select the method as GET because your API will be getting the measurements from your microcontroller.
- After you complete the form, click submit and now you have created a service.
The next step is to create a scenario.
Create a scenario
- Go to My Scenarios and create a scenario by adding a suitable name within create a scenario or add a device box.
- You will then see your scenario listed in Your virtual scenarios section below.
- Select Add an action for your scenario option and then click on Add an action to this service.
- Assign your new service to your scenario.
- You will see your Device ID. Copy and save this for later purposes.
- You will then be asked for Get or Post method. Choose the Get method.
Copy and paste this string in the box:
?hData=$hData$&celData=$celData$&fehrData=$fehrData$Step 04: Testing the API
You can simply click on Test Scenario after completing the configuration of your scenario. You will get a message saying that the scenario was successfully run. Open your Google sheet and you will see $hData$,$cData$ and $fData$ in the Heart rate (in BPM), Body Temperature (in °C) and Body Temperature (in °F) columns, respectively.
You could also substitute values instead of the other variables. For that, you can use this:
http://api.pushingbox.com/pushingbox?devid=(YOUR-DEVID)&hData=77&cData=36&fData=96.8If you get the values recorded correctly, you can move on to the next step, but if there are some issues, try checking the previous steps.
Step 05: Setting up your hardware
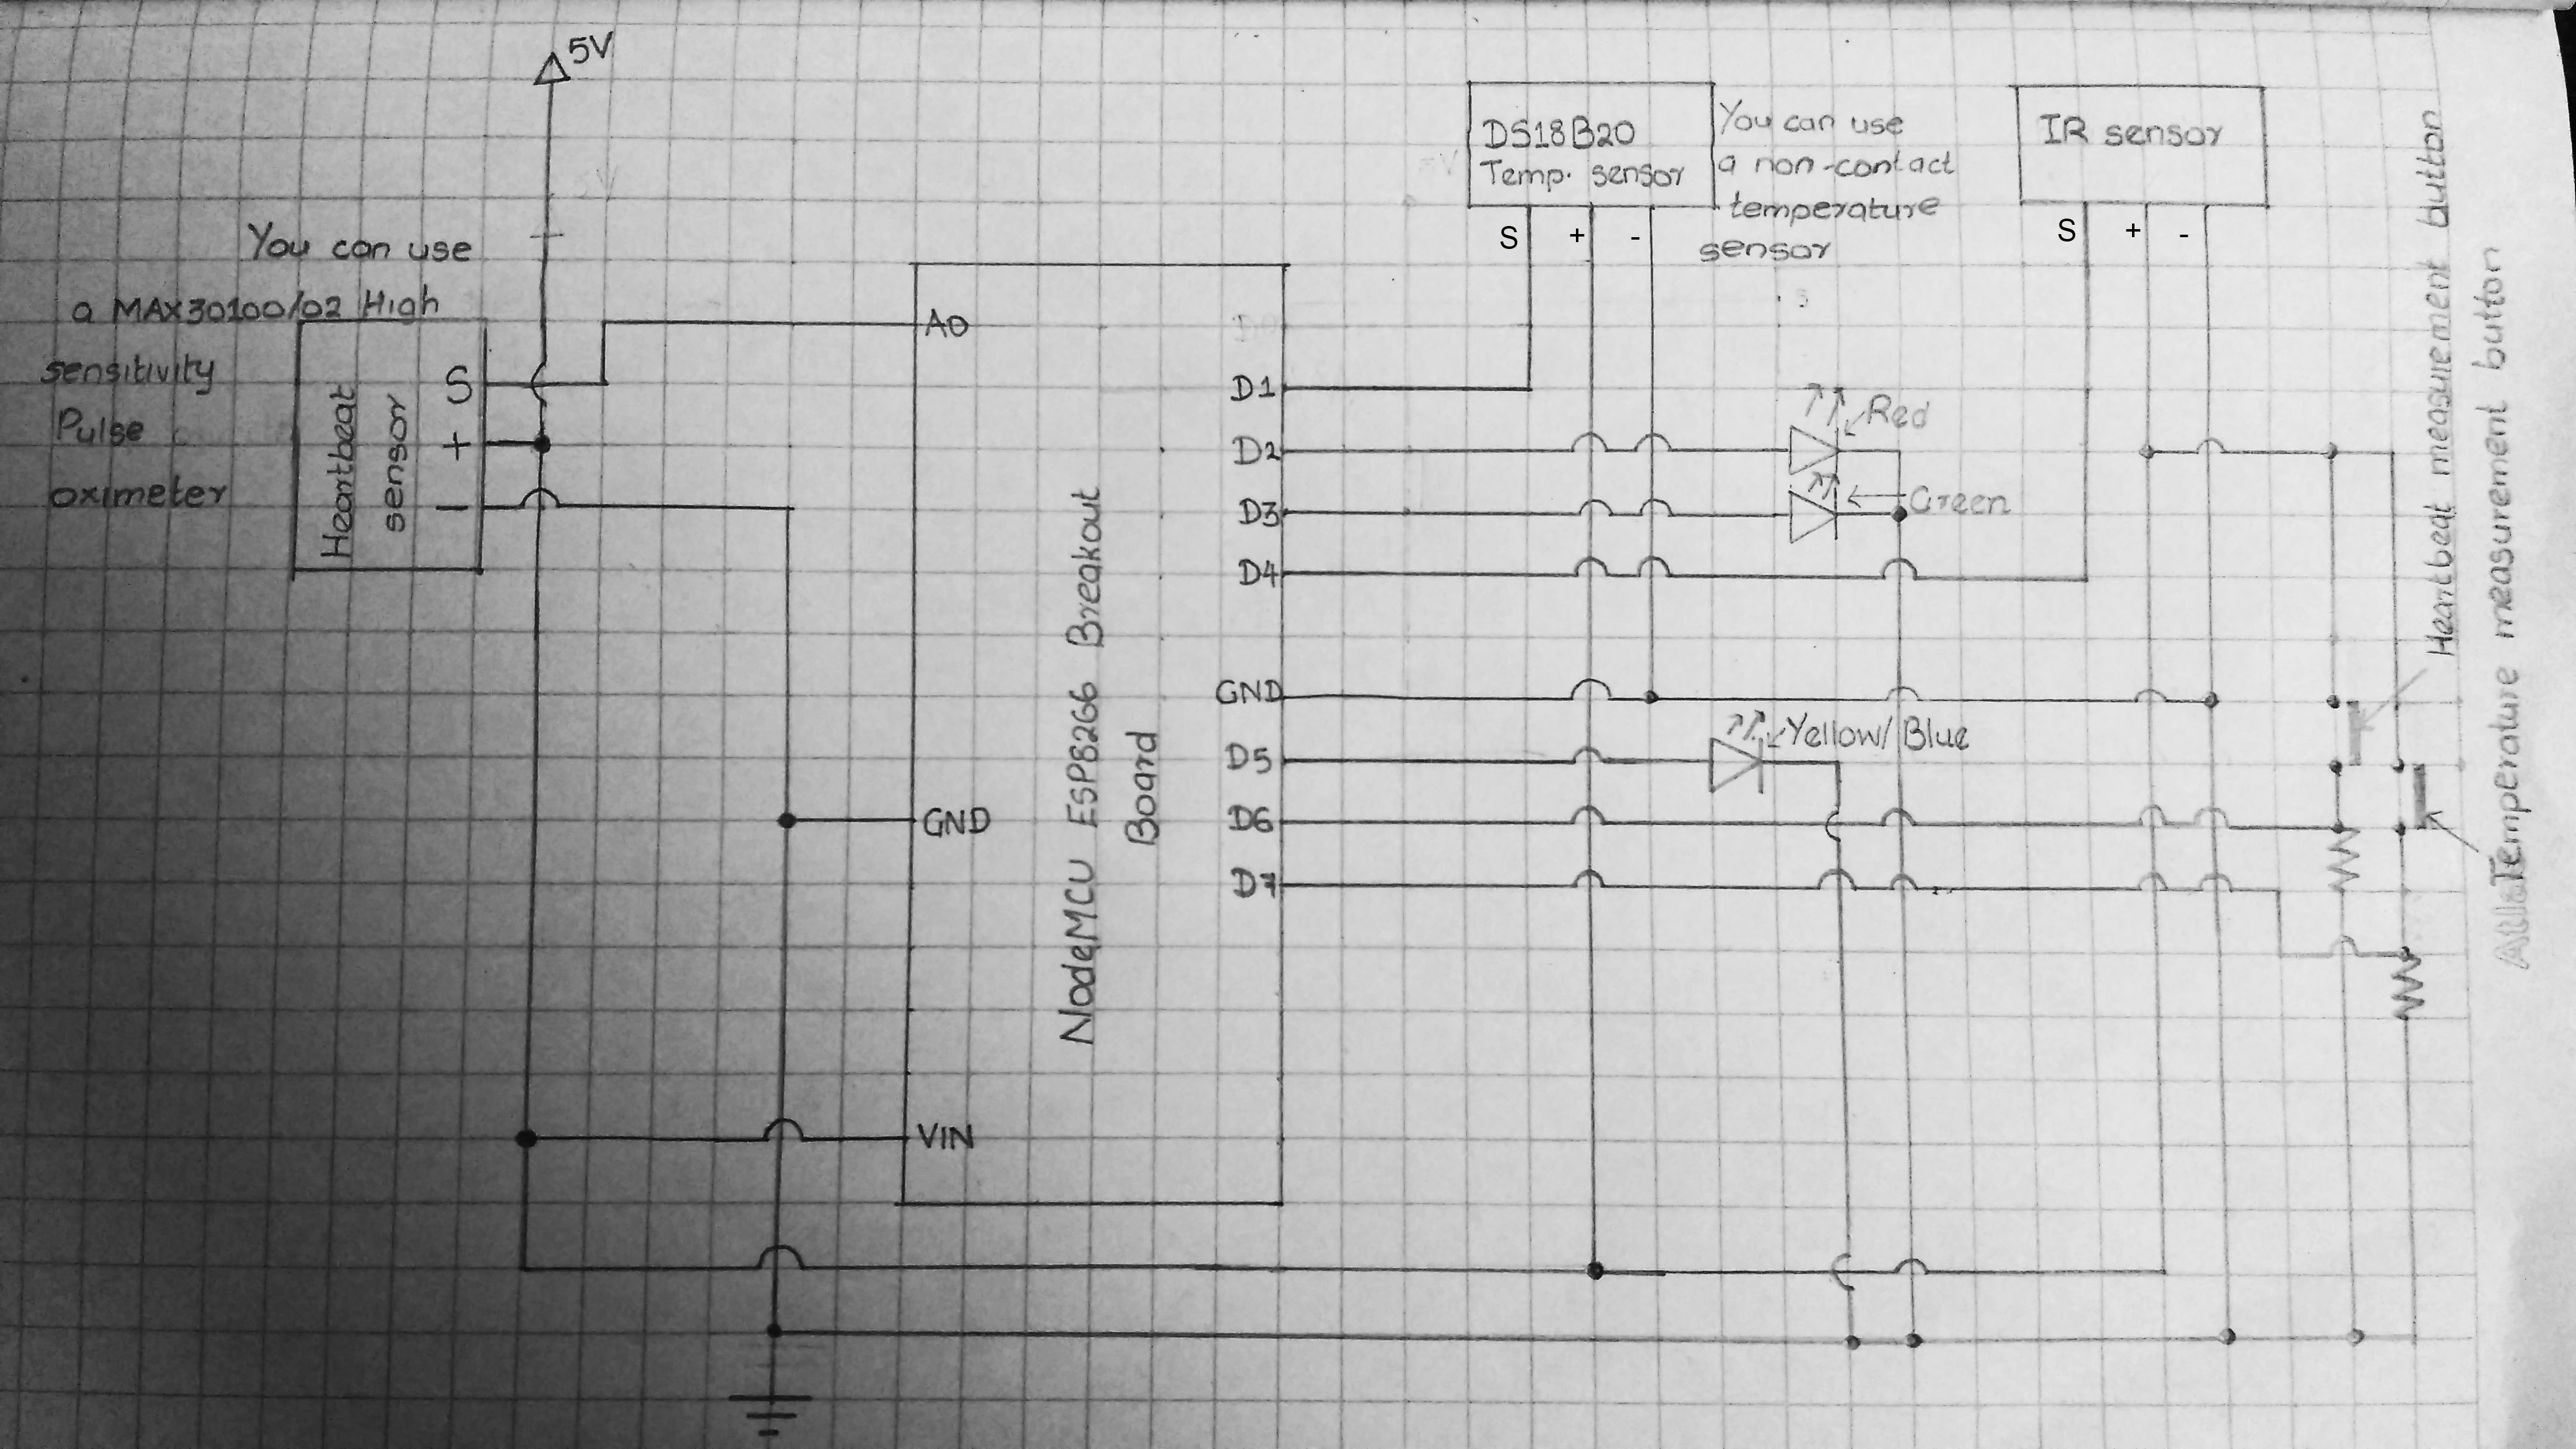
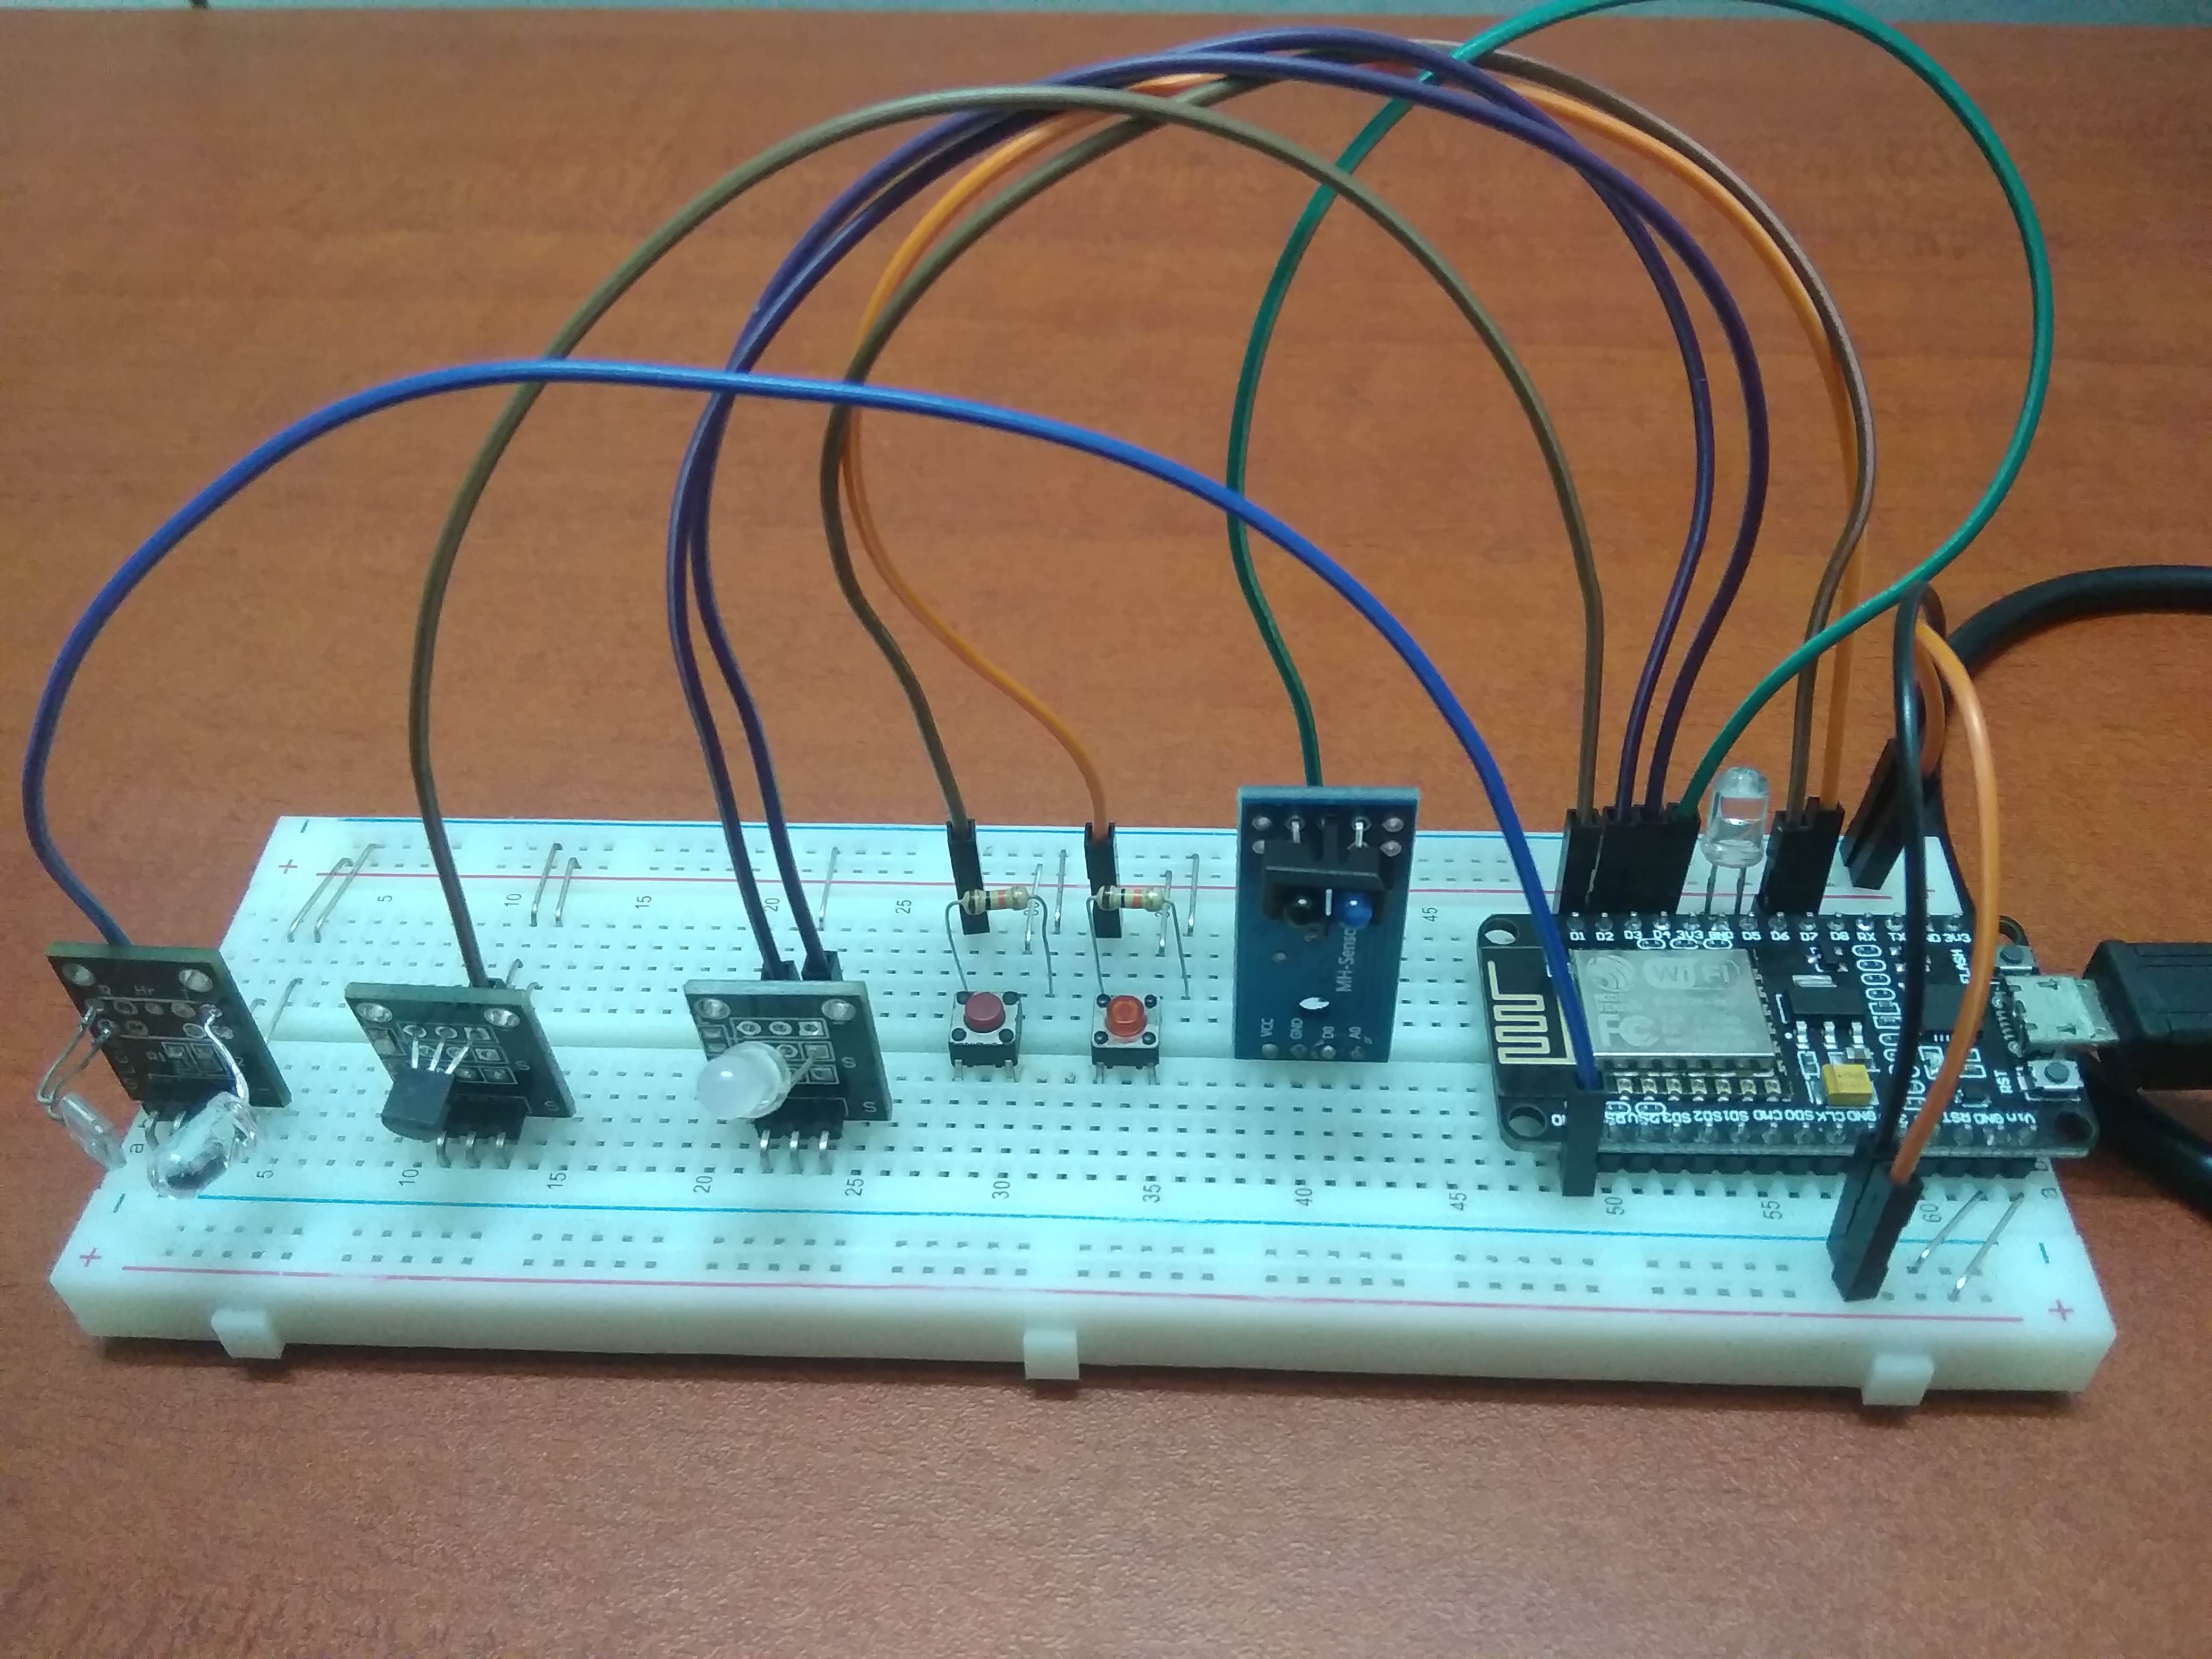
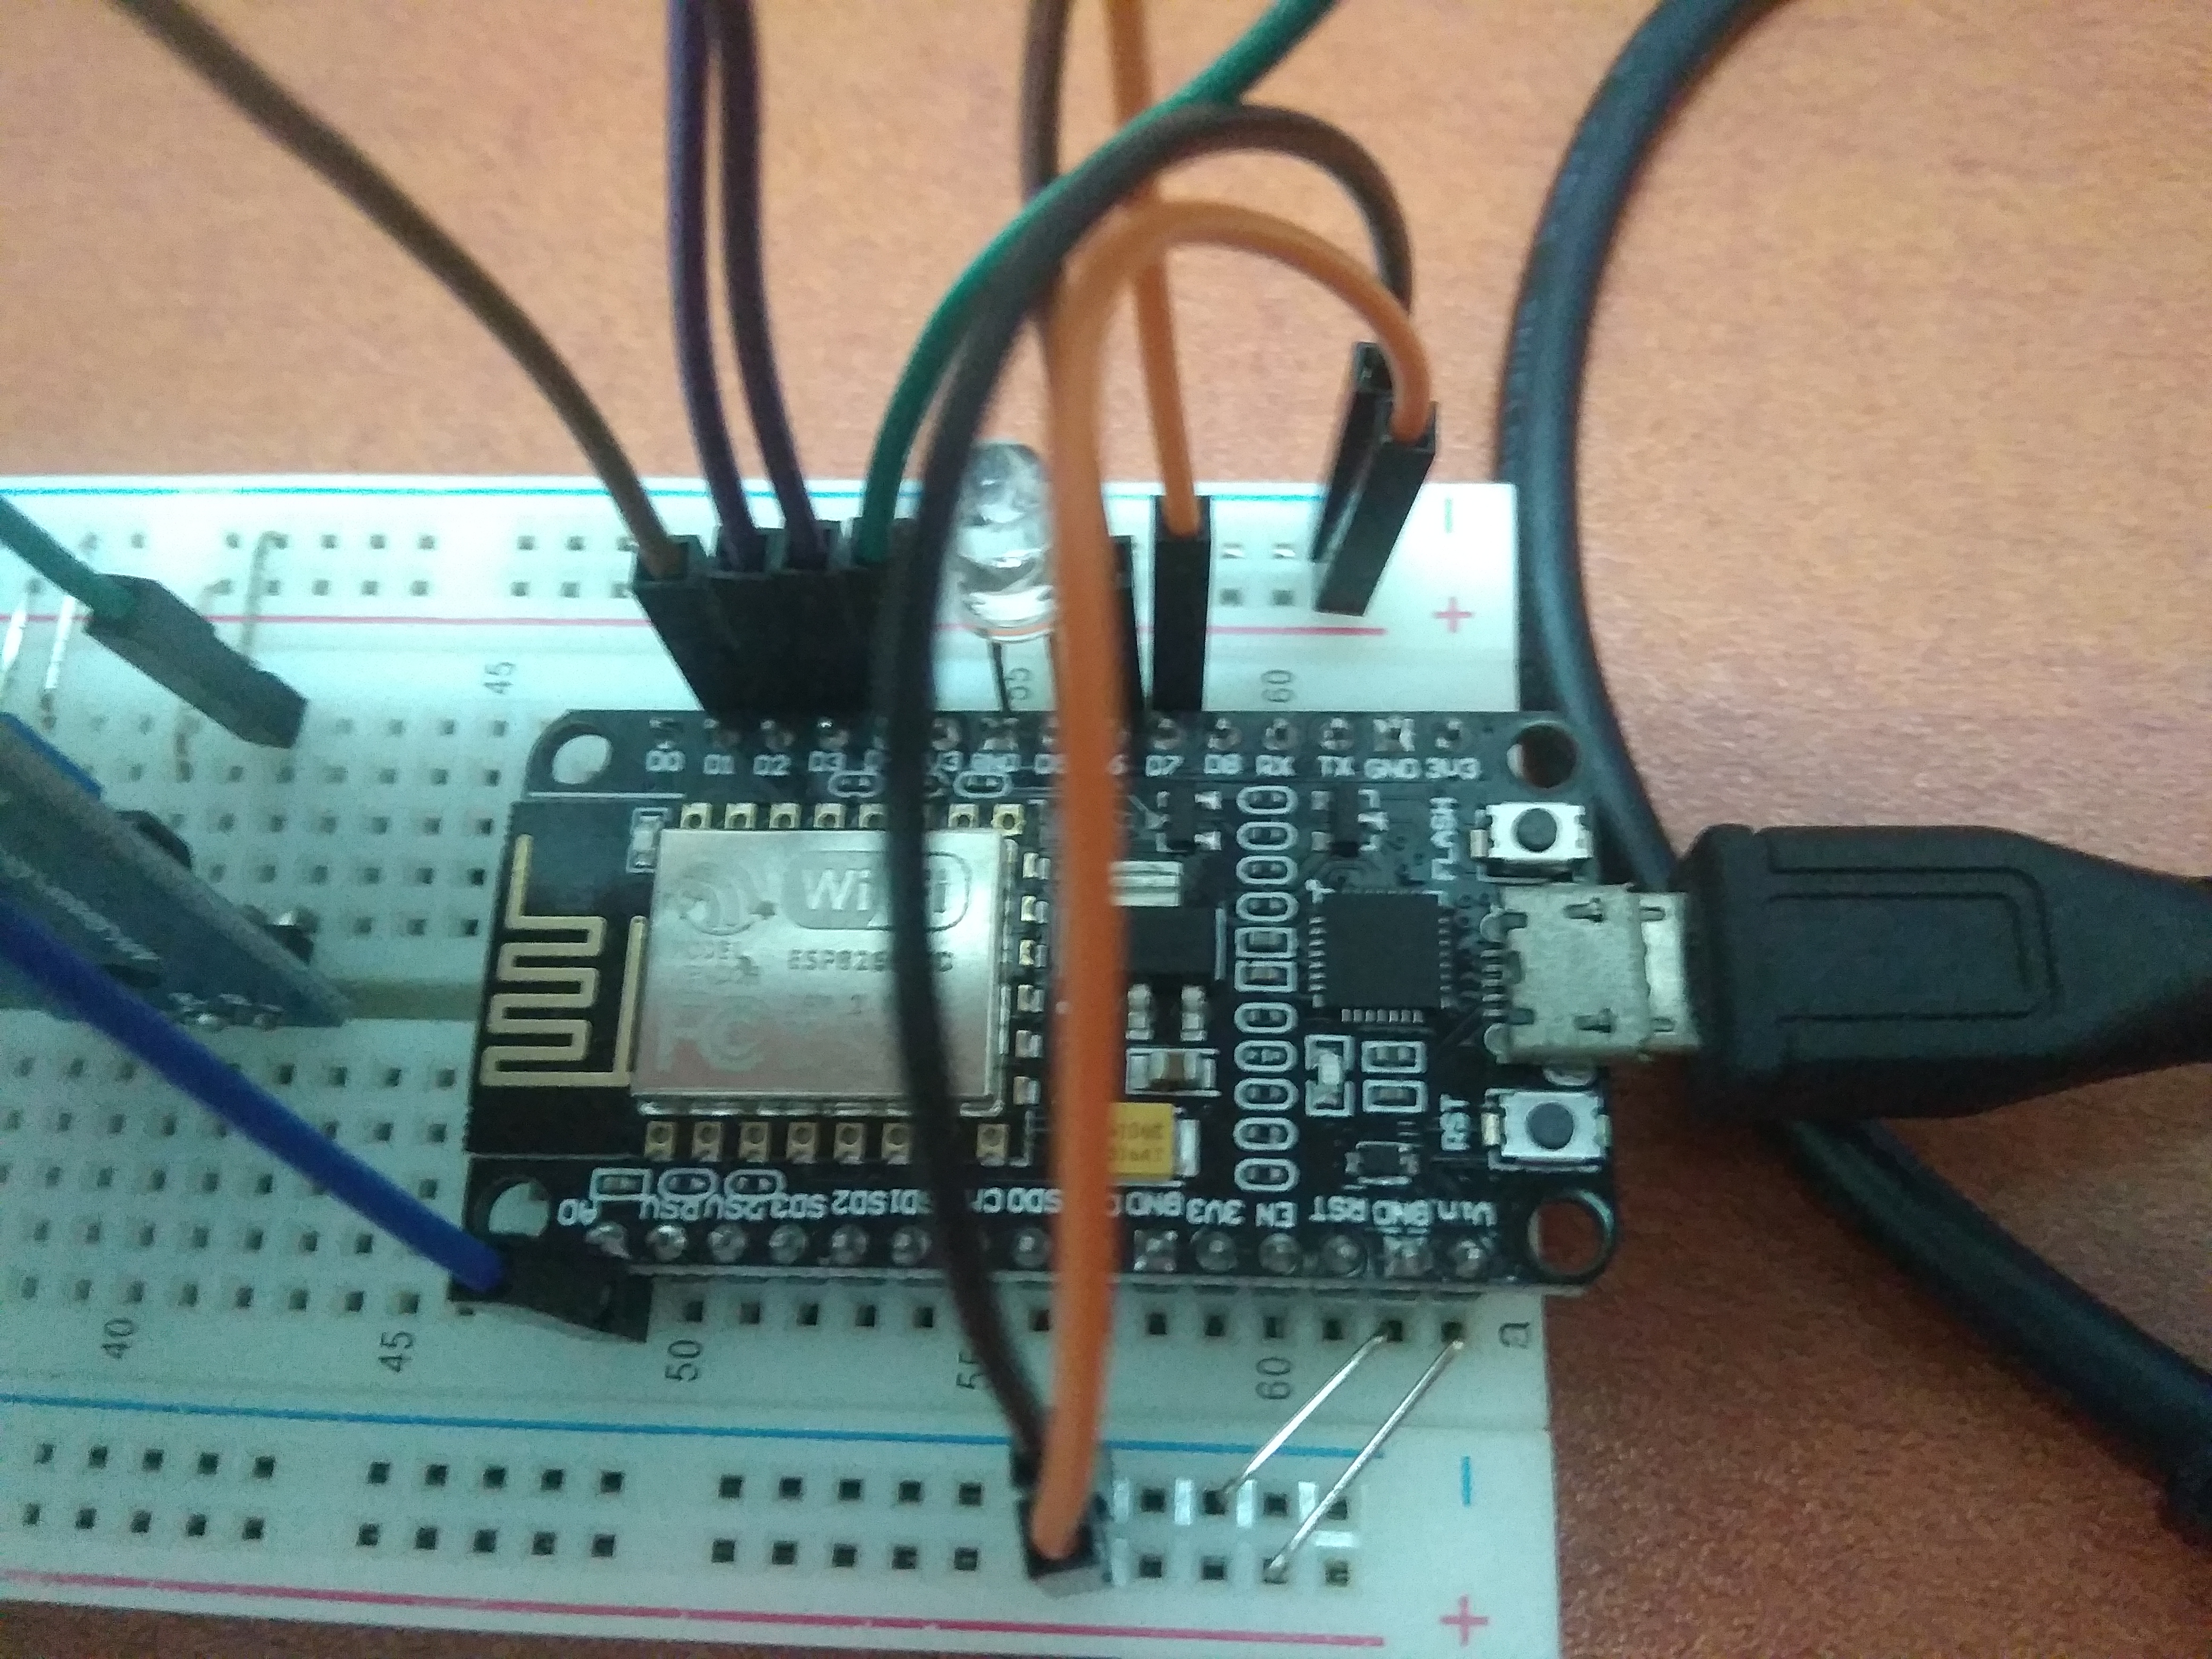
Follow my schematic posted in the Schematics section to connect your components.
I could not get all the components in my Fritzing app, so I decided to draw the schematic by myself.
Step 06: Libraries required for this project
You will be needing the following libraries for this project (these will not be needed if you use the Non-contact temperature sensor module and MAX30100/02 high sensitivity pulse oximeter):
- PulseSensorPlayground library - https://github.com/WorldFamousElectronics/PulseSensorPlayground
- OneWire library - https://github.com/PaulStoffregen/OneWire
- DallasTemperature library - https://github.com/milesburton/Arduino-Temperature-Control-Library
- ESP8266WiFi library (Built-in library for NodeMCU microcontroller)
Step 07: How the sensors work (Skip this if you are using the non-contact temperature sensor module and MAX30100/02 high sensitivity pulse oximeter)
The heartbeat sensor which I have used in this project is quite tricky to work with. You should not place your finger on it too lightly or too hard because your blood flow would be interrupted and the measurements will be less accurate and the precision of the results will be affected.
The heartbeat sensor module used in this project uses the reflective method. The IR LED in the heartbeat sensor module emits Infrared wave, and the photodiode measures the amount of light reflected. The intensity of the light reflected depends on the blood flow in your finger. This is how a heartbeat sensor work.
Read this tutorial to learn how to use the DS18B20 temperature sensor module (you do not have to read this if you are using the non-contact sensor module):
https://randomnerdtutorials.com/guide-for-ds18b20-temperature-sensor-with-arduino/
Step 08: Preparing your Arduino sketch
You must prepare an Arduino sketch to make a request to the API and to record your health measurements.
Before you use your heartbeat sensor module, you will need to set the threshold values. To set the threshold values, upload the 'Getting Started Project' sketch to your NodeMCU microcontroller. This sketch can be found in the examples folder.
Go to File ----> Examples ----> PulseSensor Playground and select the sketch.
After determining the threshold value, enter that value in the codes. You can find the Arduino codes required for this project in the Code section.
A video showing how this system works


_3u05Tpwasz.png?auto=compress%2Cformat&w=40&h=40&fit=fillmax&bg=fff&dpr=2)
Comments
Please log in or sign up to comment.