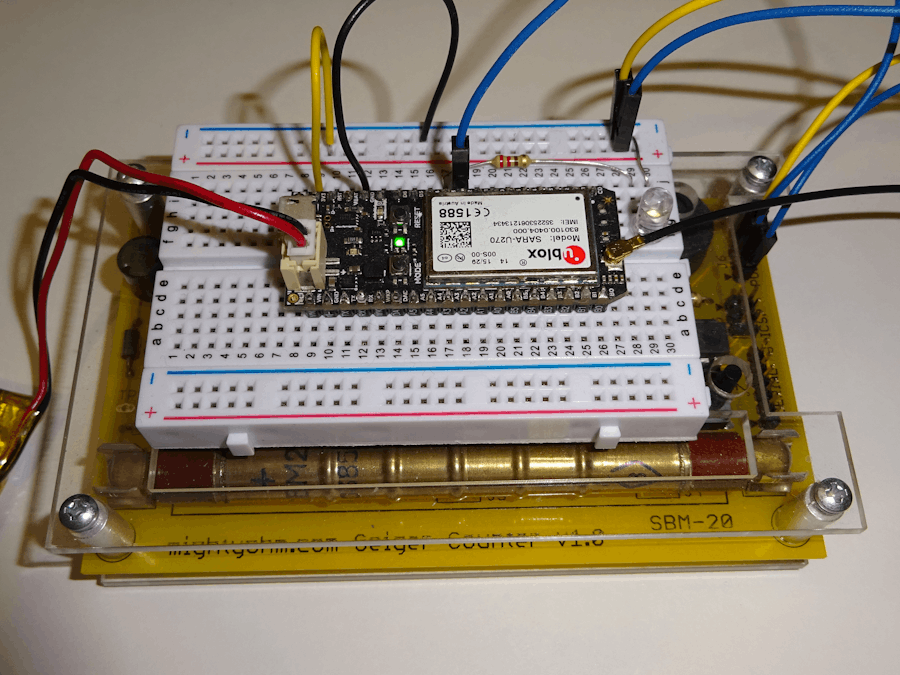
Nobody wants to be around a Geiger counter when it's going crazy, with this project you can connect your MightOhm Geiger counter to the internet via WiFi or Cellular with a Particle Photon or Electron.
The Geiger CounterThe main part of the project is the MightOhm Geiger counter, the kit for this and instructions for assembly are available on the website:
http://mightyohm.com/blog/products/geiger-counter/
All the components on the Geiger counter are Through-hole components so they are nice and easy to fit, the only difficult bit is adjusting the voltage for the GM tube and even that is fairly easy.
Follow the excellent instructions to assemble the Geiger counter and fit the Geiger counter into the acrylic case.
You wont need batteries so if you prefer you can leave the battery box off, it will be powered by the Photon or Electron so be sure to leave the batteries out. You may also wish to not fit the speaker as the only way to mute it is by pressing the button and it powers up with the speaker enabled.
Extending the Geiger CounterThe Geiger counter comes with a very handy 3 pin connector for power and pulse. The Photon/Electron connects to this to supply the Geiger counter with 3.3V DC and to monitor the pulses from the counter.
Connect GND and 3V3 from the Photon/Electron to the two outer pins of the connector (3v3 on the left, GND to the right) then connect D2 to the pulse (middle) pin.
Optionally connect an LED to D3 via a 1k resistor and to GND. This is helpful to check that the device is receiving the pulses in-line with the Geiger counter. The on-board RGB LED is used to indicate the radiation level (green low, yellow warning and red danger).
Either a Photon or Electron can be used, and the code works for both.
Their is also a serial port on the Geiger counter that could be used to read the radiation levels, however I wanted access to the raw pulses and didn't want to have to decode the serial data so I went with the pulse pin for this design.
SoftwareThe same code runs on both Photon and Electron, the only difference is that the Photon sends data more frequently than the Electron (It's easy to go over the free data limit when you send every minute with an Electron).
When a radioactive particle (no, not that Particle) passes through the Geiger Muller tube this ionizing radiation causes conduction between the anode and cathode in the tube, this pulse is detected by the on-board micro-controller and buffered to the pulse pin of J6 (the 3 pin connector) which is connected to D2 on our Particle device.
Each pulse on pin D2 causes an interrupt to the CPU, this increments a counter. Every second these counts are stored into a time series bin and then the sum of 60 of these 'per second' bins is taken to give a rolling average "Counts per Minute". Having the pulses in 1 second bins allows for a faster response to raised radiation levels rather than having to wait 1 minute to compute the CPM average.
The Counts per Minute value is is assigned to a cpm Particle.variable() which can be read externally, the value is also published as a senml formatted measurement along with the state of charge of the battery so it can be handled by Tinamous (an Internet of Things platform which connects up Particle and other devices to record and plot the measurements and provide notifications).
The software also publishes a status message if it detects a high radiation level. The electron lasts about 3 days running on just battery, the software does not do any power saving at this time.
Monitoring Radiation LevelsThe Geiger counter presented here is fairly simple in that it just logs counts per minute of radiation to the internet and does not store or display them. This is where Tinamous comes in. Tinamous captures the sensor data from the Photon/Electron, stores it and plot the results in real-time.
To add your own Geiger counter:
- And a Particle Bot.
- Wait for the Particle Bot to discover all of your devices and then view the data.
The measurement fields are automatically when a measurements is published and the field is not found in Tinamous, these can be hidden from the chart by un-checking the visible property of the field, or deleting the field is you are no longer using it.
The chart below shows the radiation level as logged by the Electron.
You can see the radiation level in real-time on Tinamous here: https://ddd.tinamous.com/Devices/Electron-3G-1


Comments
Please log in or sign up to comment.