


Hardware components | ||||||
_ztBMuBhMHo.jpg?auto=compress%2Cformat&w=48&h=48&fit=fill&bg=ffffff) |
| × | 1 | |||
Software apps and online services | ||||||
 |
| |||||
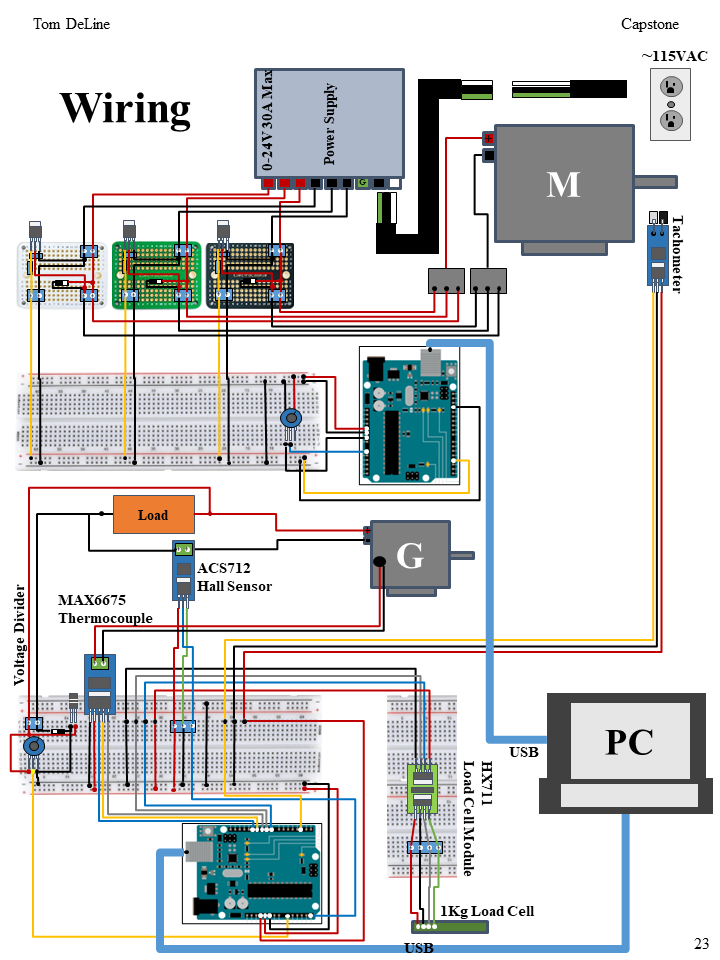
The purpose of this project was to build a machine capable of measuring the performance of electric motors and generators as part of a capstone project in my bachelor's degree. To evaluate performance, the Dynamometer motor is directly coupled to the shaft of the motor/generator being measured. Once coupled, the machine determines how much torque is required to spin the shaft at different RPMs with an electric load attached to the electric terminals of the motor/generator being measured. In some future project posts, I'll try to break down the individual parts of the project for a closer inspection.
How the machine measures TorqueTo determine the torque required to spin the shaft of the generator, the motor of the Dynamometer is mounted in the machine such that the body of the motor is capable of freely rotating about the central axis of the shaft (Figure 1). By measuring the rotational force applied to the central axis shaft while the machine is on, a relationship can be developed between torque, RPM, and load.
Controlling the DynamometerTo control the Dynamometer, a serial console session can be established with the machine by USB cable. After establishing the connection, the user is prompted with a decision tree to select how the machine operates. In Dynamometer mode, the user can select from a list of speed profiles;
- Sweep
- Max Speed
- Speed Select
- Potentiometer Mode
The data is recorded in a csv file through a second serial connection monitored and recorded by putty console logger. The output can be exported to a graphing program such as Microsoft Excel.
Problem StatementA fellow student's project required the ability to evaluate the power output of a motor/generator to determine the feasibility of using different motor sizes/types for a bicycle powered electric generator. The generator attached to the bicycle in Fig 3 is the component which the fellow student requires the ability to be evaluated.
A dynamometer is a device capable of evaluating motor performance under load. The dynamometer needs to be capable of measuring RPM, determine the output Voltage/Current from the generator, determine the torque required to spin the motor, and measure the motor temperature vs power output. Normally, this type of machine (dynamometer) would measure the torque produced by the motor being evaluated. In this specific application however, the machine measures the torque required to rotate the generator shaft for loaded/unloaded conditions.
Dynamometer SpecificationsCharacterizing the Arduino Uno PWM Signal is necessary for simulating the Arduino Uno Micro-controller in LTSpice. By defining the Turn-on/Turn-off times and the Period of the signal, LTSpice can emulate the function of the Arduino PWM signal. Based on measured values, the Arduino-Uno PWM output frequency is 490.19Hz This switching frequency is well within the audible range of human ears and will likely be heard through the motor at nearly every RPM.
Simulation of the control circuit was performed in Ltspice XVII. A small-scale prototype system was built and tested on a small 12V DC hobby motor utilizing a single MOSFET for switching operations.
The small-scale circuit validated the current through the MOSFET in the simulation. Further simulation of a slightly modified circuit to include 3 MOSFETs was then performed to confirm the idea of utilizing 3 MOSFETs in parallel to evenly split the power dissipation into 3 MOSFET heatsinks.
Once verified, the circuit was built at full scale. As seen in Fig 16, the MOSFET gate is pulsed with a PWM signal to adjust the output voltage applied to the Dynamometer motor and thus vary its speed.
ResultsThe first documented measurements with the Dynamometer were of RPM. To make this measurement, a piece of black electrical tape was wrapped around the output shaft of the machine motor. A white chalk marker was then used to draw a single white line along the shaft as depicted in Figure 20. An IR distance module was used to track the amount of time it takes for the white line to make 1 revolution.
The pulseIn(pinToMonitor, Rising/Falling Edge) function built into the Arduino IDE is used for monitoring the pulse length as received from the IR module each time the white line reflects the IR light. To calibrate the tachometer, the motor was set to run at 12.0(V). The oscilloscope in Figure 21 measures the amount of time elapsed between pulses.
Since the oscilloscope pulse length matches the length of the pulse measured by the Arduino, a simple calculation of RPM can be concluded from:
Where time is initially recorded in microseconds but can be converted to minutes through basic unit analysis.
As seen in Figure 23, the measurements include some amount of undesired noise. To reduce the amount of noise reported by the system, the code compares the rate of change of the pulse length with a constant value.
If the rate of change is larger than the constant, the data is not reported by the controller and the noise is omitted since the motor can’t physically accelerate or decelerate at the rate reported by the tachometer module. Figure 23 shows the amount of noise being reported by the system is high enough to significantly alter the RPM output. Below is the code which does the checks the rate of change of the tachometer.
// This conditional statement is for catching output during first loop of data stream
  // If the rateOfChangeArray > 20k, the motor is accellerating and data is recorded.
  // After the first run, if the rateOfChangeArray < 55k, the signal is interpreted as valid
  // Otherwise, the data is considered noise and not output by the system.
  // Values outside of specified range are not possible since the motor would be accellerating/decelerating at rates not possible by motor
  if (run1 == true) {
    if (rateOfChangeArray[globali] > 20000) {
      rpmFloat = (1 / timePerRev) * (1000000) * (60);
      rpm = round(rpmFloat);
      if ((rpm > 0) && (rpm < 3500)) {
        //Serial.print("RPM =, ");
        //Serial.print(temperature); Serial.print(", "); Serial.println(rpm);
        //Serial.println(timePerRev);
        Serial.print(millis()); Serial.print(", "); Serial.print((-1)*(scale.get_units()), 4); Serial.print(", "); Serial.print(thermocouple.readCelsius()); Serial.print(", "); Serial.print(rpm); Serial.print(", "); Serial.print(DividerVMap); Serial.print(", "); Serial.println(currentReading, 3);
        run1 = false;
      }
    }

  }

  else {
    //Serial.println(rateOfChangeArray[globali]);
    if (rateOfChangeArray[globali] < 55000) {
      rpmFloat = (1 / timePerRev) * (1000000) * (60);
      rpm = round(rpmFloat);
      if ((rpm > 0) && (rpm < 3700)) {
        //Serial.print("RPM =, ");
        //Serial.println(temperature); Serial.print(", ");
        Serial.print(millis()); Serial.print(", "); Serial.print((-1)*(scale.get_units()), 4); Serial.print(", "); Serial.print(thermocouple.readCelsius()); Serial.print(", "); Serial.print(rpm); Serial.print(", "); Serial.print(DividerVMap); Serial.print(", "); Serial.println(currentReading, 3);
        //Serial.println(timePerRev);
      }
    }
  }
Figure 24 however shows the correct RPM being reported by the tachometer after filtering the noise digitally through signal rate of change analysis.
After the tachometer was successfully calibrated, the Dynamometer temperature sensor was installed and calibrated by submerging the thermocouple end in boiling water followed by subjecting it to the surface of an ice-cube. If the water measures 100°C when boiling and approximately 0°C on the surface of the ice-cube, the sensor is reporting accurately enough for the Dynamometer to compare generator temperature rise vs power output. Once the thermocouple was calibrated, baseline measurements of the machine’s motor temperature and MOSFET heatsink temperature after running at maximum RPM for 10 minutes were recorded.
The machine motor temperature increased at approximately 0.75°C per minute for 10 minutes while operating at maximum RPM with no load attached. The temperature of the MOSFET heatsink, as measured next to the M3 mounting screw of the MOSFET, maintained a relatively stable temperature of 21°C while operating at maximum RPM with no load coupled to the motor.
Calibration of the Dynamometer load cell began by measuring the mass of an aluminum block with a kitchen scale to be 396.58(g).
The aluminum block was then placed on the load cell while executing the load cell calibration sketch included with the HX711 library which can be referenced in the appendix. In the sketch, a load cell calibration factor is tuned through an active console session until the output of the load cell matches the output of the kitchen scale.
Figure 29 shows the aluminum block being placed on the scale and then removed. A histogram analysis of the load cell measurement data shows the average measured mass of the Aluminum block to be 396.51(g)
Figure 32 shows the method used for finding the exact value of the calibration factor required for the aluminum block to measure 396.58(g) and was determined to be 1721.68 based on the data collected.
With the sensor suite fully functional, a spring can be added to the Dynamometer lever arm to keep it in constant contact with the load cell. Since the load cell now has the added force pressing down on it from the spring, the code executes a tare( ) function before recording any measurements in order to zero the scale. The spring location was chosen to have minimal force pulling down on the load cell so that it’s rated values were not exceeded. The current spring location and spring size correlates to 300(g) pulling down on the load cell. This value may have to be decreased if the load cell becomes saturated, or the load cell size could be increased to the 5kg max version.
After inspecting the location of the spring and determining its location to be sufficient for testing purposes, the Dynamometer can now deploy all three of its sensors nearly simultaneously. The first ever recorded, baseline measurement of the Dynamometer operating in Max Speed mode can be analyzed and interpreted from the three graphs, Temperature vs Time, Force vs Time, and RPM vs Time, respectively.
The Generator was coupled to the Dynamometer using a 12mm x 8mm shaft coupler. Test 7 is the first test with Dynamometer coupled to the generator and the results can be seen in seen in Fig below. The peak Power Output during this test was 150W at 17.76V with RL = 2.1Ω. The efficiency of the motor during this output was 68%, but the highest efficiency calculated during this test was 72% with RL = 4.1Ω.
The generator purchased by the customer is capable of outputting 195W at 14.06V while rotating at 2783RPM. This should be more than enough power to charge a 12V DC system. The Dynamometer built for testing the customer’s generators, functioned as intended. The machine is capable of evaluating torque required to spin a generator under loaded or unloaded conditions. The machine can be re-configured to measure the amount of torque produced by a motor/generator by swapping power/load leads on the machine. In the default configuration, the machine is able to compare power input at the shaft to the power output at generator terminals. The efficiency of the generator can the be found as Pout/Pin=efficiency. The machine measures the following parameters while operating;
1)Torque
2)Temperature
3)RPM
4)Vout
5)Iout
In conclusion, the Dynamometer machine is capable of evaluatingmotors/generators through 5 different metrics and is considered a success. Future designs of the machine could include the use of an extruded aluminum frame for more rigidity. The electric load could also be automatically applied in future iterations to make for consistent time graphs.


Comments
Please log in or sign up to comment.