


In this post, I will tell you how to make cardiograph which sends data to the cloud and how to make an app to view stored data.
Update - 17 Aug 2021I started receiving comments that code doesn't compiles last year and finally got time to look on it.
What was the problem.
Firebase ESP32 library was updated and multiple add functions for different types(addInt(), addArray(), etc.) were replaced with one add() function using templates parameters.
I updated code and tested it. Now it compiles and sends data to database.
HardwareFor this project, I used AD8232 heart rate monitor from SparkFun. This module takes input from three electrodes which attached to body and gives analog signal (0-3.3V). Electrodes can be attached to body in two ways.
If you want to get more information about this module follow this link:
https://learn.sparkfun.com/tutorials/ad8232-heart-rate-monitor-hookup-guide/all#tips-and-tricks
ESP32 was chosen due to its WiFi capabilities and powerful processor. It can work with not only basic HTTP protocol but also HTTPS and SSL. Which is necessary for sending data to the cloud.
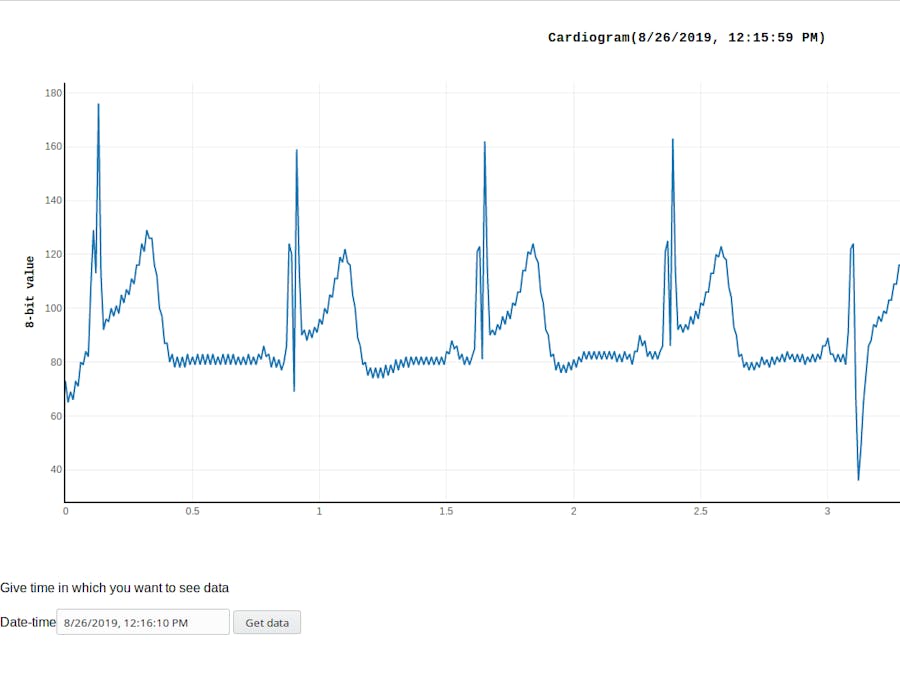
Basic overviewESP32 takes analog signal from heart rate monitor, measures it, forms package of data and sends data to Firebase realtime database. Stored data can be viewed as plot (cardiogram) with app which hosted on Firebase. Also, it's possible to choose data from certain period of time.
Firebase project initializationIt's better to start with setting up server-side since Firebase is complex system.
At first, you need to go to the Firebase console and create new app.
https://console.firebase.google.com/
After that, you need to set up node, npm, Firebase CLI to start deploying apps to Firebase. There is a good video which shows how to set up all these things. You can use this tutorial to view how to set Firebase CLI but the project initialization process will be other.
When Firebase CLI is ready you need to initialize project. For that:
1) Open terminal
2) Create and enter to project folder
3) Run Firebase init
It will show Firebase ASCII logo and then you need answer to questions to configure your project.
1) What Firebase CLI features do you want to set up for this folder?
Choose: Realtime database, Hosting, Functions
2) Select a default Firebase project for this directory
Choose 'use existing project' and choose project which you created in console
3) What file should be used for Database Rules?
Just press enter, let it be default
4) What language would you like to use to write Cloud Functions?
Choose Javascript. In tutorial mentioned that Typescript is better choice but Javascipt more common and there are more examples for Firebase written in Javascript.
5) Do you want to use ESLint to catch probable bugs and enforce style?
Choose No.
6) Do you want to install dependencies with npm now?
Choose Yes.
It will start to download different packages, it can show some warnings but thats ok.
8) What do you want to use your public directory?
Just press Enter let it be default(public)
9) Configure as a single-page app (rewrite all urls to /index.html)?
Choose No.
And finally Firebase initialization complete!
Set up timestamping functionMeasures which sends ESP32 must be with timestamp for later plotting this data on time. We can set up Google Cloud function which will be attaching timestamps to package of measurements.
Here is code which is needed to be in functions/index.js
const functions = require('firebase-functions');
const admin = require('firebase-admin');
const app = admin.initializeApp();
exports.timestamper = functions.database.ref('/measures/{pushId}/')
.onCreate((snapshot, context) => {
    return snapshot.ref.update({
        timestamp: admin.database.ServerValue.TIMESTAMP
    });
});
At the beginning, we need to include libraries/packages firebase-functions and firebase-admin. Then app object is created, it will be used for interacting with database.
Later timestamper function is declared, it will be called when a new package is added to database and it will update this with server timestamp.
Firebase hosting appFiles dedicated to Firebase hosting must be located in public folder. Now there is only one index.html template. For app, you need index.html, script.js, style.css, and favicon.ico which you can get in attachments.
In index.html we have markup for page with label, div for plotly, datetime field and button and also included script.js and style.css files. You don't have to change something here so let's move to index.js.
Here we have project configuration section.
const config = {
apiKey: "", authDomain: "",
databaseURL: "", projectId: "",
storageBucket: "",
messagingSenderId: ""
};
You need to paste here credentials from your project. To get them you need to go to project console and then to project settings.
Press add web app. Then you need to name your app and then you will get page with all needed credentials.
In script.js we have two functions last_pack() and update_plot().
last_pack() function gets from database the last package of measurements and plots them. It called when page loaded and when there is no data from user given interval.
update plot() gets data for last 12 hours from user-given time (datetime field) and plots them. If there is no data in given interval then it just calls last_pack() function.
After public folder is ready you can run 'firebase deploy' to deploy app and look at results. At the end of deploying, in terminal you can see hosting URL where your app is located.
ESP32 sideBigger part of the job is done. Now we need to connect heart rate sensor to ESP32 and upload code to it.
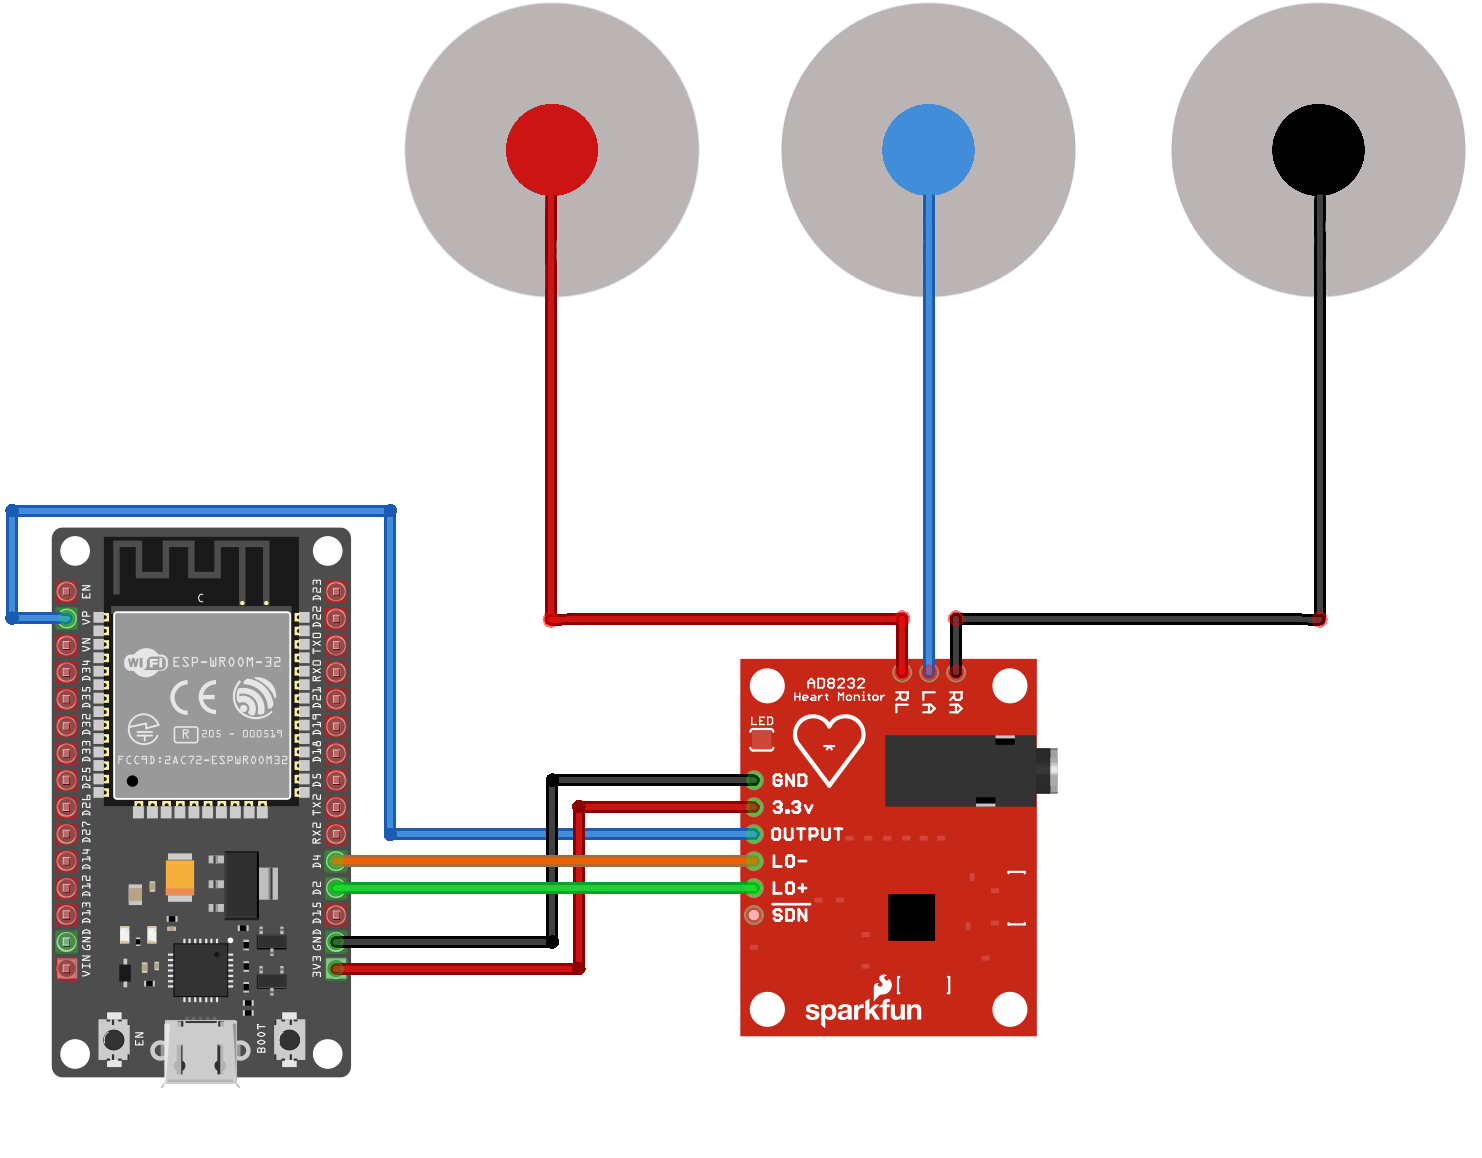
Here is hardware diagram for ESP32 dev module:
Wiring of heart rate module basically can be described like this:
3V3 -> 3V3(ESP32)
GND -> GND(ESP32)
Output -> GPIO36
LO+ -> GPIO10
LO- -> GPIO11
You need to look at pinout of your board to get where the particular GPIO pin is located because different boards have a different pinouts.
Like described earlier output gives analog signal and ESP32 will be measuring it with analogRead(). LO+ and LO- can be used to determine does electrodes connected to body.
To check does module work and electrodes attached correctly you can upload cardio_test.ino from attachments and after that open serial plotter at 115200 baud. ECG on plot can have reversed y-axis if electrodes attached incorrectly.
ECG's are notoriously noisy. This is because we are measuring muscle activation. Try not to move too much while taking measurement.
After connecting we can get to the code.
Code requirements:
1)You need to have installed ESP32 core in arduino IDE
https://github.com/espressif/arduino-esp32
2) Firebase-ESP32 library
https://github.com/mobizt/Firebase-ESP32
3) HTTPClientESP32Ex library
https://github.com/mobizt/HTTPClientESP32Ex
Code for ESP cardio_sender.ino you can find in attachments.
#define FIREBASE_HOST "" // do not include https:// in FIREBASE_HOST
#define FIREBASE_AUTH "" // database credentials
#define WIFI_SSID ""     // WIFI AP name
#define WIFI_PASSWORD "" // WIFI password
Firstly you need to paste your database and WiFi credentials. Database credentials you can get in Firebase console -> project settings -> service accounts -> database secrets.
There is warning that database secrets is deprecated but you can just ignore it.
After that you can upload code.
After WiFi and database initialization code reads analog value with 8-bit resolution from GPIO 36 and add it to JsonArray object. After it gets 500 measures, it add JsonArray to Json which will be sent. Also timestamp field will be added with 0 value. Then ESP32 sends this package of data to Firebase and waits 10min to gather new package of measures. Plot of measures will look like this:

Comments
Please log in or sign up to comment.