%MATLAB code
%Note - Replace the frequencies with appropriate frequencies of your choice
%Import the signal
downloadsFolderPath = 'C:\Users\User\*location\';
audioFileName = '*file_name.wav';
fullFilePath = fullfile(downloadsFolderPath, audioFileName);
[y, Fs] = audioread(fullFilePath);
%Filter analysis
% Design a band-pass filter of order 6
Fpass_bandpass = [f_L, f_H]; %Passband frequency range in Hz
order_bandpass = 6; % Filter order
bandpassFilter = designfilt('bandpassiir', 'FilterOrder', order_bandpass, 'HalfPowerFrequency1', Fpass_bandpass(1), 'HalfPowerFrequency2', Fpass_bandpass(2), 'SampleRate', Fs);
% Design a band-stop filter of order 8
Fstop1_bandstop = f_L; % First stopband frequency in Hz
Fstop2_bandstop = f_H; % Second stopband frequency in Hz
order_bandstop = 8; % Filter order
bandstopFilter = designfilt('bandstopiir', 'FilterOrder', order_bandstop, 'StopbandFrequency1', Fstop1_bandstop, 'StopbandFrequency2', Fstop2_bandstop, 'SampleRate', Fs);
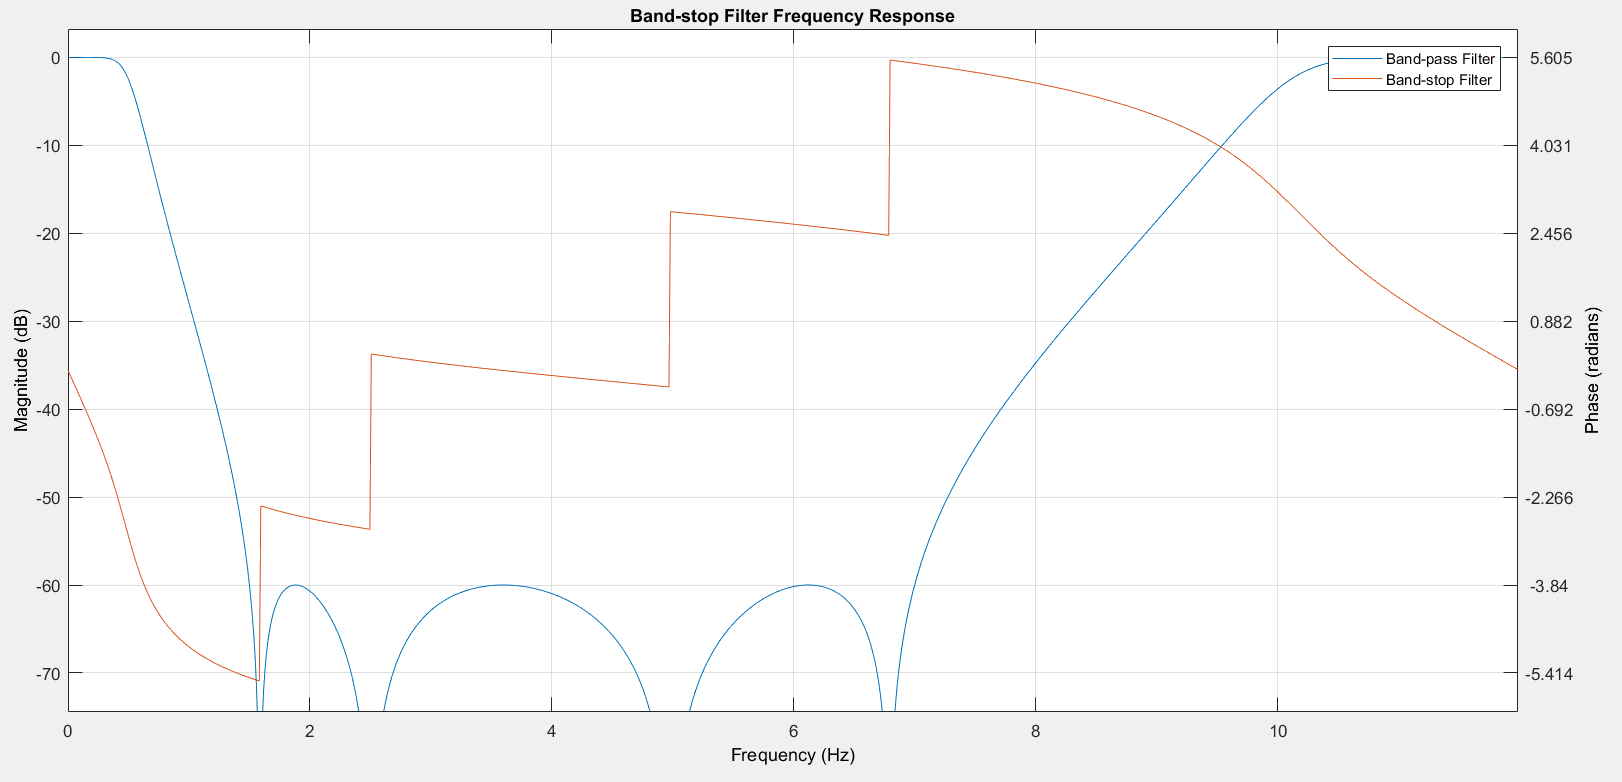
% Plot the frequency responses
figure;
subplot(2,1,1);
freqz(bandpassFilter, 1024, Fs);
title('Band-pass Filter Frequency Response');
xlabel('Frequency (Hz)');
ylabel('Magnitude (dB)');
subplot(2,1,2);
freqz(bandstopFilter, 1024, Fs);
title('Band-stop Filter Frequency Response');
xlabel('Frequency (Hz)');
ylabel('Magnitude (dB)');
legend('Band-pass Filter', 'Band-stop Filter');
% Apply the filters to the signal
cleanedSignal_bandpass = filter(bandpassFilter, y);
cleanedSignal_bandstop = filter(bandstopFilter, y);
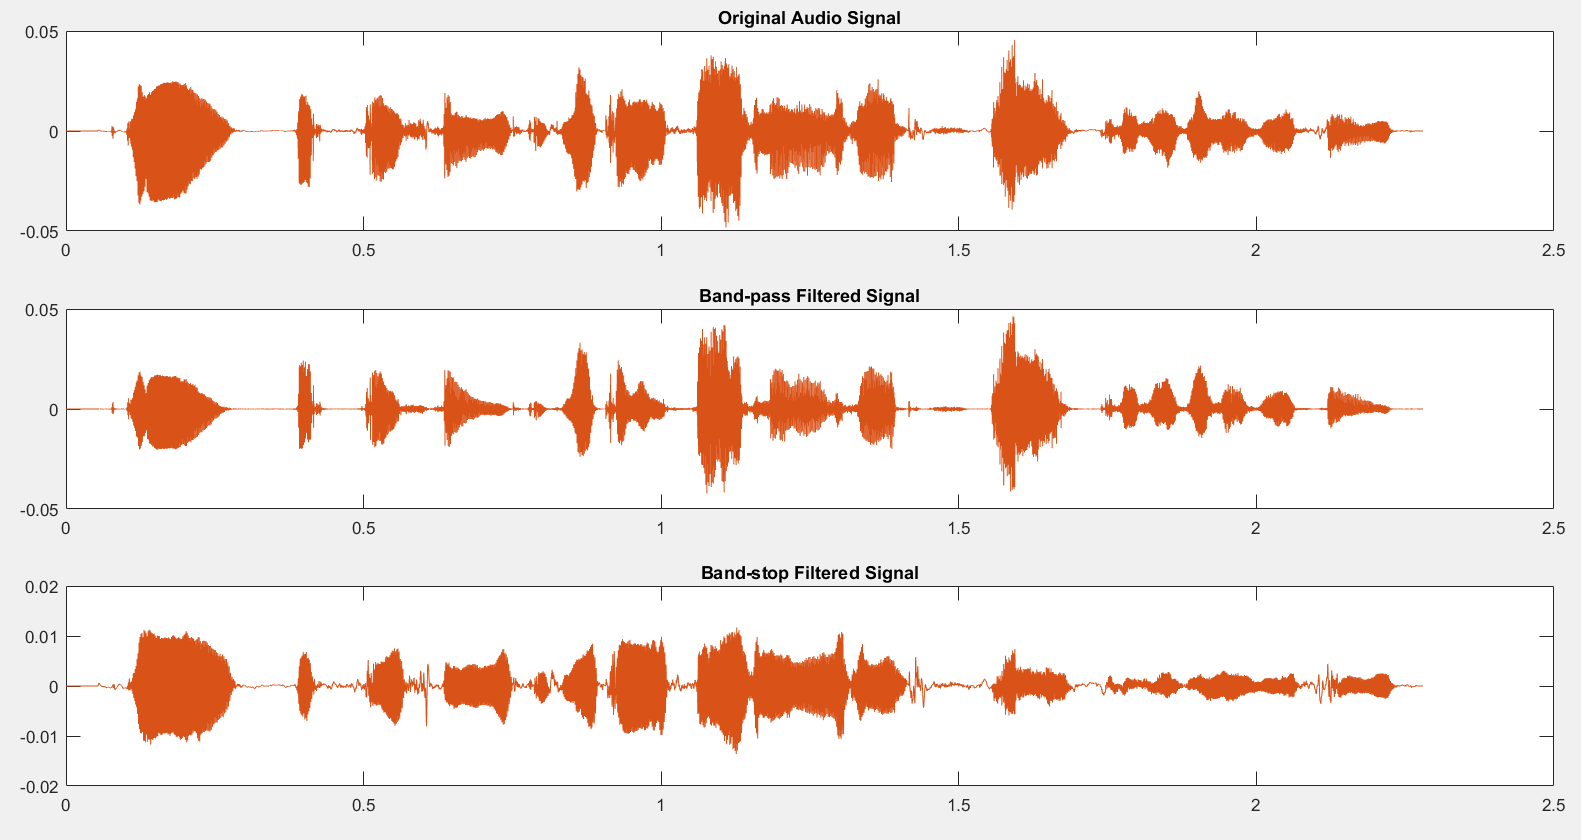
% Compare the original, band-pass filtered, and band-stop filtered signals
t = (0:length(y)-1) / Fs;
figure;
subplot(3,1,1);
plot(t, y);
title('Original Audio Signal');
subplot(3,1,2);
plot(t, cleanedSignal_bandpass);
title('Band-pass Filtered Signal');
subplot(3,1,3);
plot(t, cleanedSignal_bandstop);
title('Band-stop Filtered Signal');
% Play the original signal
disp('Playing Original Signal...');
sound(y, Fs);
pause(length(y)/Fs + 1); % Wait for playback to finish
% Play the band-pass filtered signal
disp('Playing Band-pass Filtered Signal...');
sound(cleanedSignal_bandpass, Fs);
pause(length(cleanedSignal_bandpass)/Fs + 1); % Wait for playback to finish
% Play the band-stop filtered signal
disp('Playing Band-stop Filtered Signal...');
sound(cleanedSignal_bandstop, Fs);
pause(length(cleanedSignal_bandstop)/Fs + 1); % Wait for playback to finish


Comments
Please log in or sign up to comment.