


Hardware components | ||||||
_uOW364MAan.jpg?auto=compress%2Cformat&w=48&h=48&fit=fill&bg=ffffff) |
| × | 1 | |||
| × | 1 | ||||
| × | 1 | ||||
| × | 1 | ||||
Software apps and online services | ||||||
 |
| |||||
 |
| |||||
| ||||||
The Arduino Portenta H7 boasts a wide variety of features, and the ability to run your code on two separate cores, which can also communicate with each other!
We all run into problems with our projects from time to time, so here we show how you can use a Segger JLink to debug the code running on both cores, at the same time!
Hardware SetupOnce you have your Portenta H7 mounted on the breakout board, you will need to connect your MIPS 20-pin converter to breakout the debugging pins.
Then you can wire your converter to the Segger J-Link as shown in the images below.
If you have the right pitch connectors (0.05") you can also wire up your own connector as shown in the second image:
We assume that you have already installed the Arduino IDE on your machine (if not download here).
Then install Visual Studio (2017/2019/2022), and the Visual Micro Extension, with full instructions available here.
You will also need to install the Board Package for Arduino Mbed OS Portenta Boards from the Visual Micro Explorer (or from Boards Manager in Arduino IDE).
You will need to replace the USB Driver on Interface 0 of your Segger J-Link using the Zadig.exe tool (see video at the bottom for a walkthrough).
Lets Code!Now we need to setup a separate project, one for each core of our Portenta Board. The code attached is a simple Blink example, where each core blinks a different coloured LED. For debugging set up each core in a separate instance of Visual Studio.
Don't forget to ensure you call the bootM4() function on your M7 Core project to ensure both cores are running.
Debug Setup: M7 CoreOpen your M7 Core Sketch and select the Debug > Hardware, and the Segger J-Link Debugger (NOT the "NoOpenOCD version)
Build and upload your M7 Sketch to the M7 core at this point.
Software Setup: M4 CoreOpen your Sketch and select the Debug > Hardware, and the Segger J-Link Debugger (NoOpenOCD)
Build and upload your M4 Sketch to the M4 core at this point.
Start DebuggerFirst start debugging using the M7 Core sketch by using "Debug > Attach to Process".
Then start debugging using the M4 Core sketch by using "Debug > Attach to Process".
You should now be able to add a breakpoint to either sketch, and watch the debugger stop on it..... with each core being able to stop/step/continue independently!!
See a walkthrough for this process below on YouTube....
Useful Links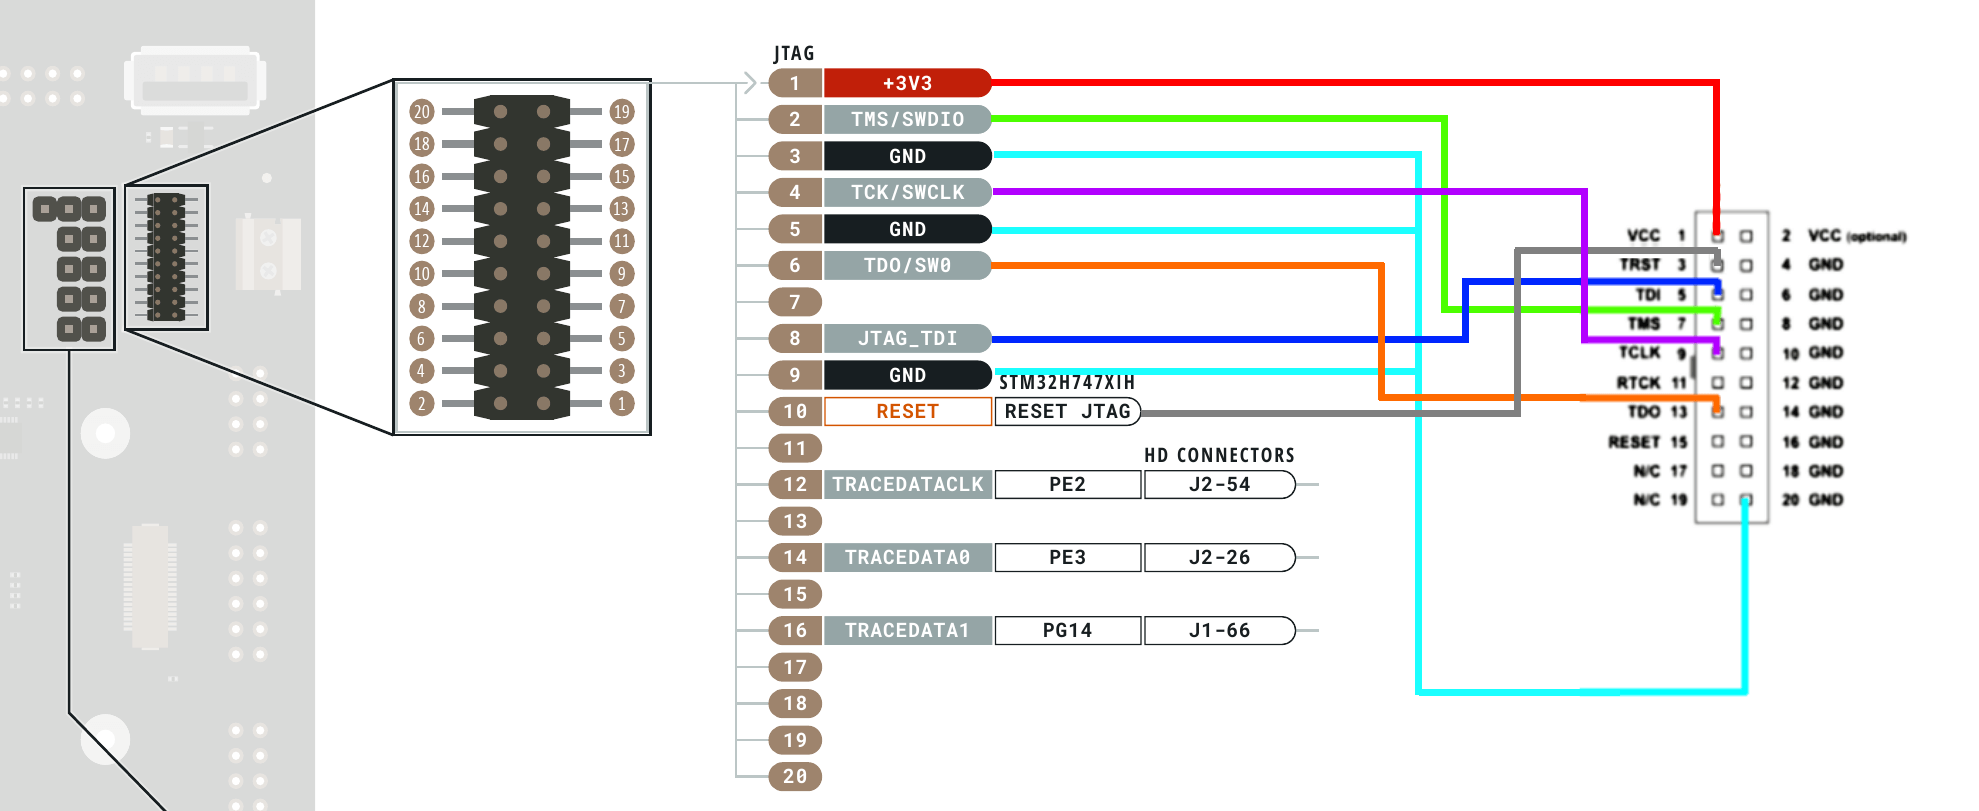


Comments
Please log in or sign up to comment.