If you want to access the power of WiFi on the latest Raspberry Pi Pico W board, this article is for you!
We will show how to get setup, as well as how to make your own debug probe from a separate Raspberry Pi Pico board, giving full debugging features.
This guide also applies if you have a standard Raspberry Pi Pico board, just select the right board later on in the guide.
IDE SetupFirst we will need to install the latest (2.3.2) board package to get all of the WiFi features.
Add the below JSON URL to the IDE Locations screen:
https://github.com/earlephilhower/arduino-pico/releases/download/global/package_rp2040_index.json
Then you will be able to select the Raspberry Pi Pico/RP2040 board package in the Micro Explorer:
All versions above 2.3.0 are compatible with the Pico-W boards, however installing the very latest will allow access to more features.
Debug Probe CreationIf you want to create your own debug probe from a separate Raspberry Pi Pico board, simply flash the image as detailed here. Don't forget to update the driver on Interface 2 of the Pico-Probe using the Zadig tool.
This is referred to as the "Pico-Probe" from here on in the article.
NOTE: A variety of other debug probes can be used, such as the FT2232 MiniModule, FT2232H Dual Interface Probe, ESP-PROG. Wiring diagrams for all probes can be seen on this page.
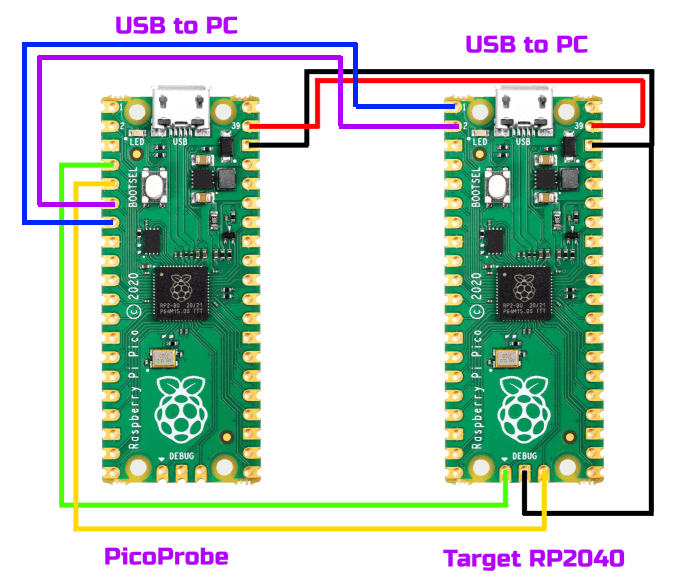
Pico-Probe WiringWire your Pico-Probe to your Raspberry Pi Pico (or Pico-W) as shown below:
This also includes the Serial1 Rx/Tx lines from the target Pico/Pico-W board, so only the USB connection from the Pico Probe needs to be connected to the PC.
Sketch SetupThere are a number of WiFi examples included with the board package, which can be accessed from the Micro Explorer > Examples Tab.
NOTE: To run all serial through the PicoProbe, you will need to change all references to Serial to Serial1.
We have included a copy of the WifiScan example from the board package, with all references to Serial changed to Serial1 already.
Board SelectionEnsure you set the Build Configuration to "Debug".
Now you will be able to select your "Raspberry Pi Pico W (Picoprobe)" board from the board list.
Also select the COM port for the Serial data (shown as COM19 in the above image towards the right).
There are additional options for CPU Speed and Flash Size on the Board options Menu:
No additional selection is required to upload your code through the PicoProbe. This is automatically done by selecting the board with (Picoprobe) on the end of the name.
Debug Tool SelectionTo select the Debug tool, use the toolbar options (if configured), or select from the vMicro > Debugger Menu:
- Debug: Hardware
- Hardware Debugger: Picoprobe
- Compiler Optimization: Default
Set a breakpoint in your Sketch by clicking in the left hand margin:
Debugging can be started in two ways:
1) Build and Upload your code as normal, then use Debug > Attach to Process
2) Use Debug > Start Debugging, to perform the Build & Upload, and begin the debugging session.
Once it has started you can add and remove breakpoints, as well as step over individual lines of code, into and out of function calls, and watch variables live at runtime!
There is also a video guide showing how to set this up below:
Useful Links


Comments
Please log in or sign up to comment.