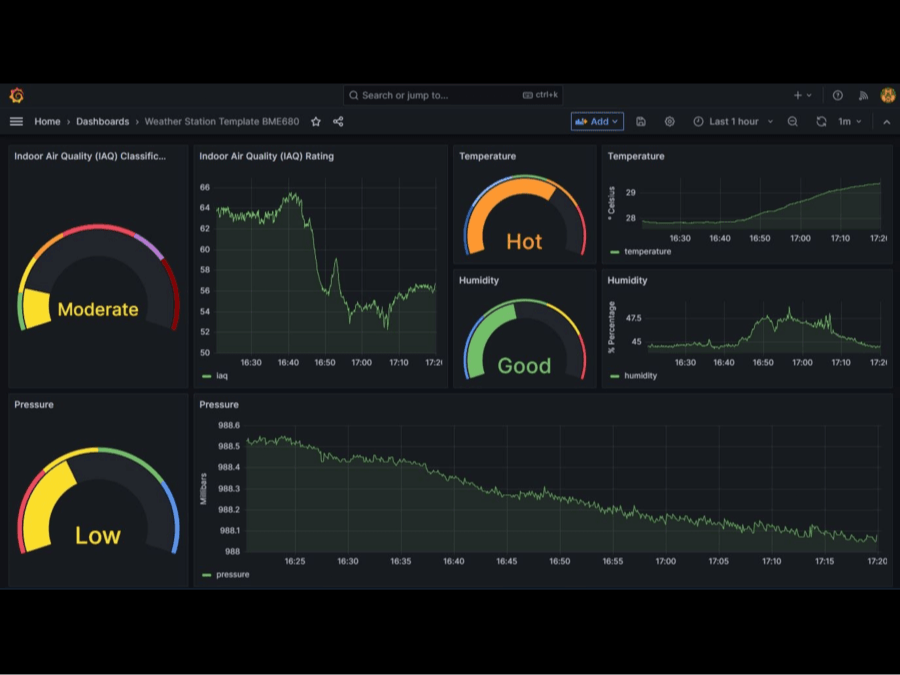
Our project is an Easy-to-Set-Up Weather Station for Raspberry Pi users. Using a Raspberry Pi 4 8GB and a BME680 sensor, the station can monitor temperature, humidity, pressure, and indoor air quality in real-time. What makes it unique is that it's powered by the AI Agent Host, an evolving platform designed to support future AI features. As the cherry on the cake, you can also utilize the weather station as a powerful development environment, enabling you to explore and experiment with various data processing, analysis, and visualization tasks.
Why did you decide to make it?The idea behind creating this Weather Station was to showcase the versatility and capabilities of the AI Agent Host as a powerful development environment. While the weather station itself provides valuable real-time data on temperature, humidity, pressure, and indoor air quality, it's just the tip of the iceberg. The AI Agent Host has the potential to support much more complex AI and machine learning tasks, serving as an extensible platform for future projects.
How does it work?The Weather Station is remarkably user-friendly and requires minimal setup. As a result, the Weather Station is essentially ready to use out-of-the-box. All you need to do is connect the BME680 sensor to your Raspberry Pi with the I2C interface, and the AI Agent Host takes care of the rest. Your Grafana dashboard will start displaying real-time data on temperature, humidity, pressure, and indoor air quality almost instantly after running the Python script for data stream processing.
Getting StartedIt will take approximately 15 minutes to install DietPi and another 15 minutes to install the Weather Station.
1. Set Up Parameters:
After installing the AI Agent Host, open VS Code in your browser through an HTTPS connection. Navigate to >project/weather-station/data-stream-processing.py.
The script is pre-configured to connect to a QuestDB instance using the following credentials:
conn = psycopg2.connect(
    dbname="qdb",
    user="admin",
    password="quest",
    host="<docker_host_ip_address>",
    port="8812"
)
Replace <docker_host_ip_address> with the actual IP address of the Docker host where your Raspberry Pi is running.
2. Run Python File in Terminal:
Execute the Python script from the terminal to start collecting weather data.
3. Connect to Grafana Dashboard:
Open your browser and navigate to the Grafana interface. Select the weather station dashboard to start monitoring your data in real-time.
4. Advanced Customization: Accurate IAQ, VOC, and CO2 Data with LCD monitor
If you're interested in obtaining more accurate Indoor Air Quality (IAQ), Volatile Organic Compounds (VOC), and CO2 data, you can modify the Python script to incorporate a C library specific to your sensor. After updating the Python script, you'll also need to update the Grafana dashboard to include these new metrics. This ensures that your enhanced and more precise environmental data will be accurately reflected on your Grafana dashboard.
Additionally, consider integrating an LCD monitor to your Raspberry Pi setup. This customizable enhancement complements Grafana's web-based visualization, providing flexibility in monitoring and interacting with your data.


Comments
Please log in or sign up to comment.