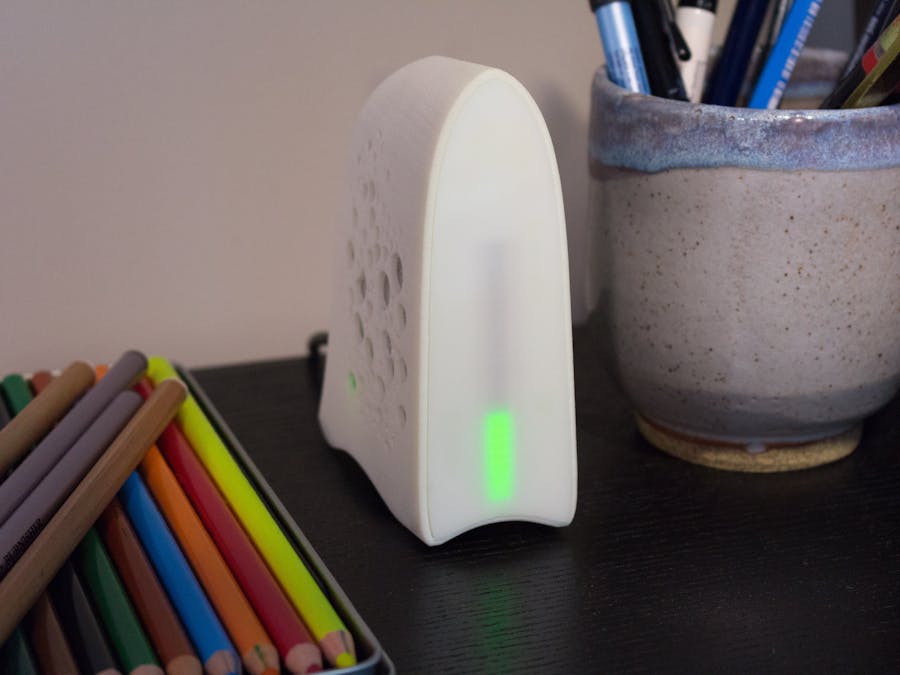
This project shows how to build a CO² for use in your home or office. With this device you can know at a glance if the air you are breathing is high in carbon dioxide. Using a simple color coded LED bar graph it displays the current CO² level. Each band is roughly 100 ppm of CO² increase. The range of the device is from 300 ppm (1 led lit) to 2,700 ppm (all 24 leds lit). For the precise reading use your mobile phone and connect to it over Bluetooth to monitor/track readings over time.
A few years ago I learned about a study from Berkeley Lab that showed a possible link between indoor Carbon Dioxide levels and human cognitive performance. Here's a link to that study. It was also reported in the Washington Post as well as TreeHugger and some other news outlets a few years back. The findings of the Berkeley group are pretty striking. Here's an image that summarizes their results pretty well.
When I first read these reports I was working for a startup in San Francisco. Our office was "scrappy" and a bit crowded. It was also in an older building with no real heating or cooling systems. During colder weather, with the windows closed, the office was noticeably stuffy. People would get sick frequently, including myself. I started getting migraines. It was not fun. There are many factors that influence health. It could have been the startup stress causing my health issues but I believe the environment also played a factor.
Environmental factors impacting workforce health are not new. Mining, handling chemical hazards, or manufacturing all impose health risks to the people who work in those environments. However, it's only within the last few decades with more people working in office buildings that we have started looking into what's known as "sick building syndrome."
I had not heard about this until after I learned about this CO² study and started doing more research. The more I researched the more sick building syndrome started to seem like a very real thing.
Last year another study was published out of Yale that confirms the findings of the Berkeley study. You can read about that here and the journal article here. Although the Yale study also includes VOC's the findings show again, for even moderately low levels of CO², there is a decreased cognitive performance in those individuals studied.
Although not quite the same presentation, here's the results from their findings. As you can see, as CO² levels go up several of their indicators have distinct downward facing trends. Their "strategy" indicator takes a pretty steep drop.
I find these results very fascinating. We now have two solid studies showing similar findings. But like many good areas of research the more you learn the more questions you have. Specifically, I wonder what is it about CO² that causes these results? Or more broadly, is it causal or simply correlative? These studies indicate results are causal but their study sizes are a bit small. Would we see these same results across hundreds of people? And how are we actually measuring the performance factors? Are these factors relevant to actual human output in a business setting? etc...
So, what we have are lots of questions, really interesting research, and some readily available hardware to start exploring this on our own. Using my experiences with air quality, and enjoyment in hardware hacking as motivation I set out to create a device that I could use to learn and experiment with CO² in my own office/home.
Breadboard PrototypeThe sensor is a SenseAir K-30. It's accurate and low cost (relatively speaking). It speaks a few different protocols and also has analog outputs. Designed for industrial/commercial use, this sensor was more than adequate for use in a prototype.
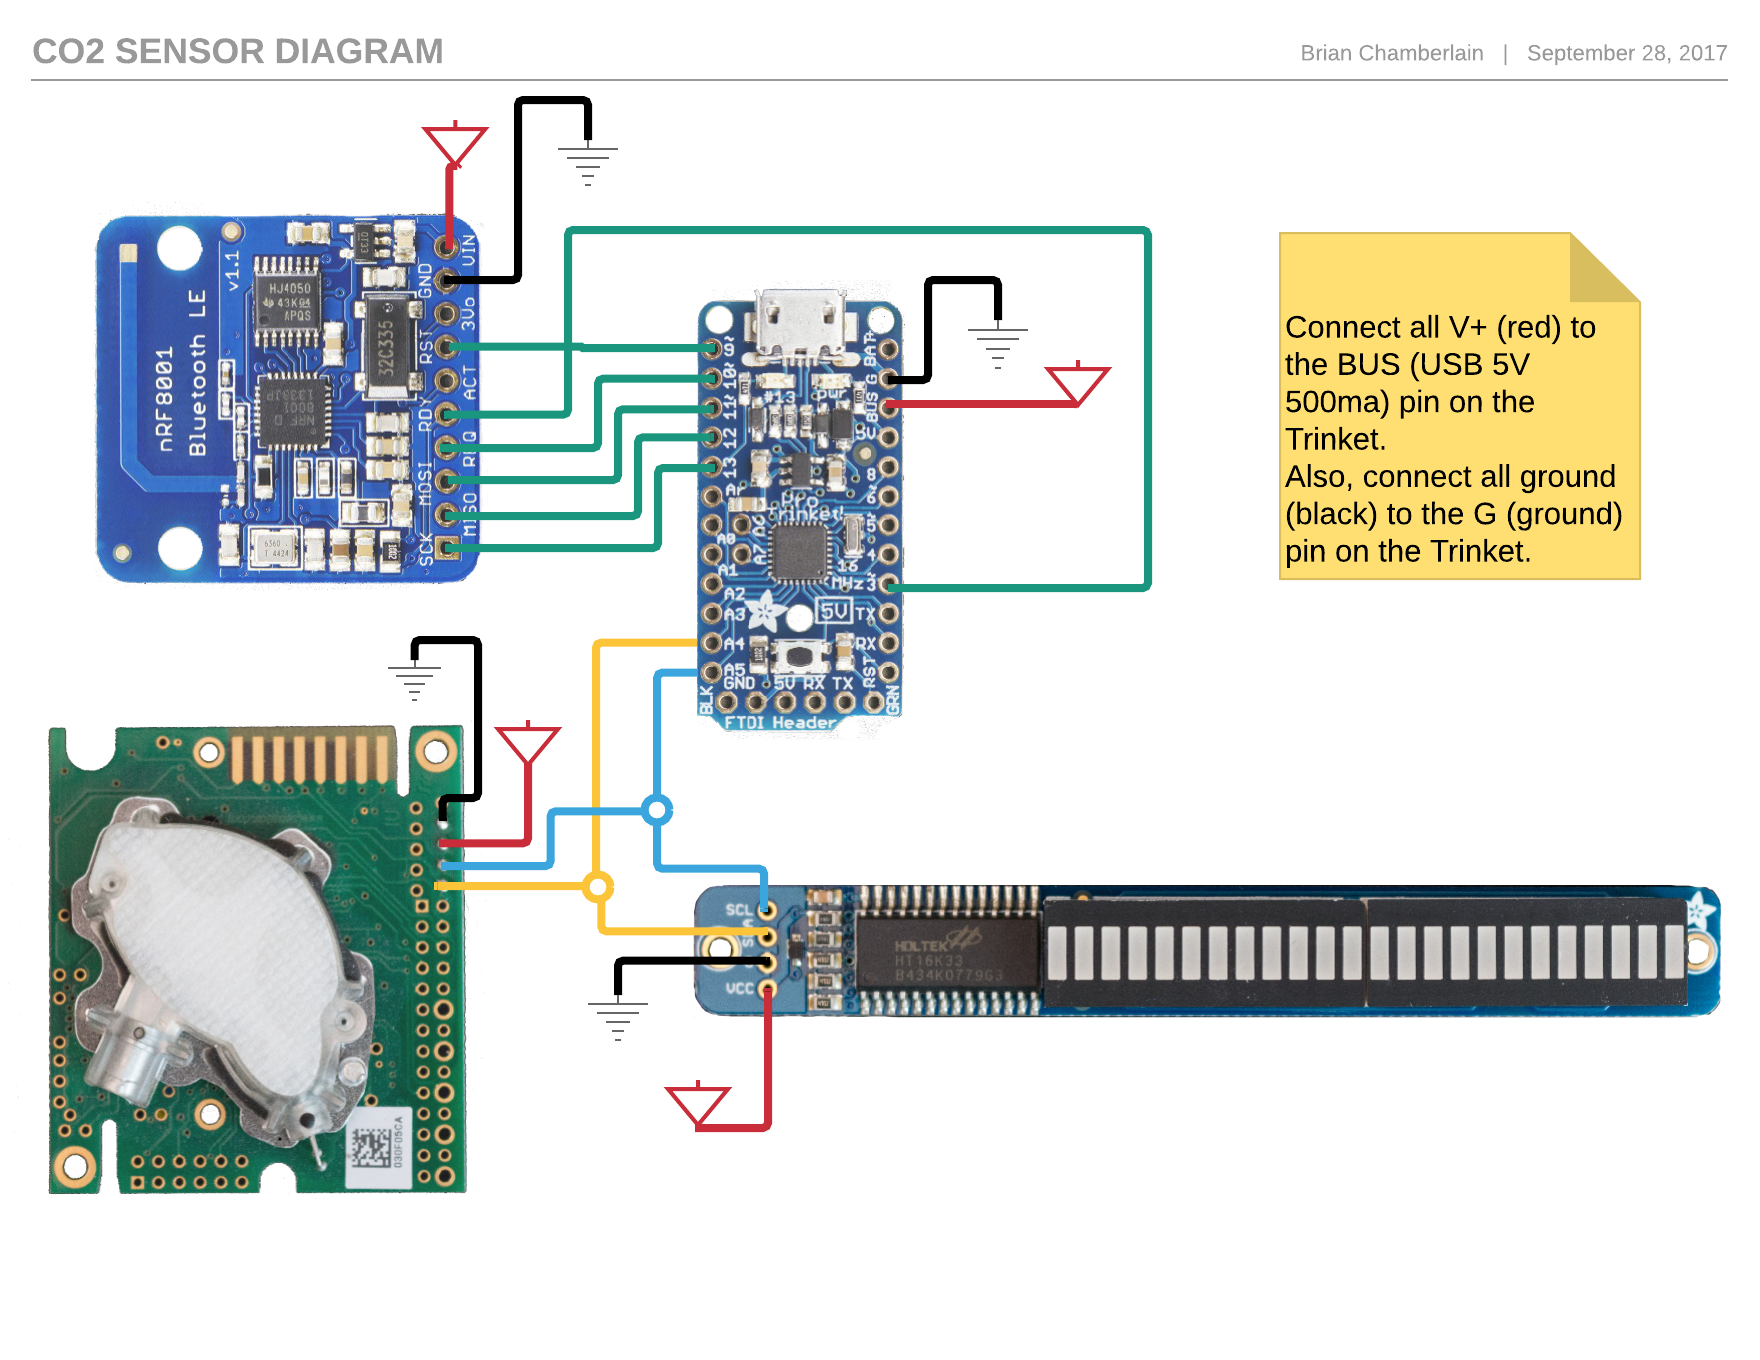
My first step was getting the Arduino to talk to the sensor using I2C. I preferred this instead of UART because my plan was to add in other I2C sensors in the future. I2C is well documented, has many libraries and is easy to uncover data transmission bugs using a logic probe. It also supports many devices on the same data lines.
It was a little tricky to get these two devices talking. At one point I had to break out the logic analyzer to watch the I2C data lines (pictured above). If you look at the code you'll notice some special code for reading from the K-30. Thankfully, I found this really helpful resource on how to connect the K30 to an Arduino using I2C. They (CO2meter.com) also have a resource on how to connect this sensor over serial as well.
Once I had the I2C to the sensor working I added in the I2C LED bar graph. Using I2C meant I could chain the K-30 sensor and the LED bar graph to the same lines. The bar graph sorts out the readings into three color groups based on the research findings. Green (300-1000 ppm) is OK, Yellow (1100-1900 ppm) is CAUTION, Red (2000-2700 ppm) is ALERT!. Carbon dioxide is not a life threatening gas at these low levels. But if the meter shows red you should probably open a window or something.
The last test was to add in the NRF8001 and get that working. This was fairly simple using the SPI libraries and the one for the NRF8001 from Adafruit. There is also the uNRF UART Android app (pictured below). It was very helpful in debugging. They make one for iOS which works well too (but it doesn't work on iOS 11 yet).
As you can see in the photo above I am using the nRF UART app to communicate with the Arduino over BLE. It uses the very simple UART Bluetooth LE profile. Any text characters you send from the Arduino show up as lines of text on the mobile app. Every minute or so a new reading is sent over.
In the final functional version, the components run off the 5V supplied by the microUSB connection. The code runs on the Arduino Trinket and uses I2C to read the CO² levels and then update the bar graph. Then, the Arduino communicates to the NRF chip using SPI and sends out the readings over UART to whatever is listening via BTLE.
Here's the full code as a gist on github. I've added quite a few comments in the code so hopefully it's easy to follow.
EnclosureOnce I had my working breadboard circuit I got to work putting it on a proto-board and mounting that in my DIY enclosure.
The assembled prototype turned out to be little big for the enclosure I chose so it's not possible to use the screws to hold it together. Instead I had to wrap a rubber band around it. Not the best approach but it works (rubber band not pictured).
After I finished this prototype I started thinking about other variations of how it might look as a product. Here are some of the sketches and clay models I used to evaluate possible shapes for this future device.
After a few more months I was able to put together a more polished "works/looks like" prototype. This one I have sitting next to my desk. It uses a custom PCB and a 3D printed enclosure and laser cut front panel. It looks much better than the original prototype but it's not quite what I'd like to see in a final product.
I've now had three of these devices running continuously for a couple years now. They work really well and help me keep an eye on the indoor CO² levels. It's surprising how much it fluctuates during the day. Levels can get on the high side, especially during the summer when the windows are closed and the AC is on. The bar graph on the front helps remind me to open the windows to let fresh air in, even a tiny crack in the window helps keep levels low.
If you are interested in learning more about CO² sensing or are interested in making one of your own feel free to ask questions in the comments section. I'm happy to answer any questions about this project, indoor air quality, or the build process.
Cheers!


Comments
Please log in or sign up to comment.