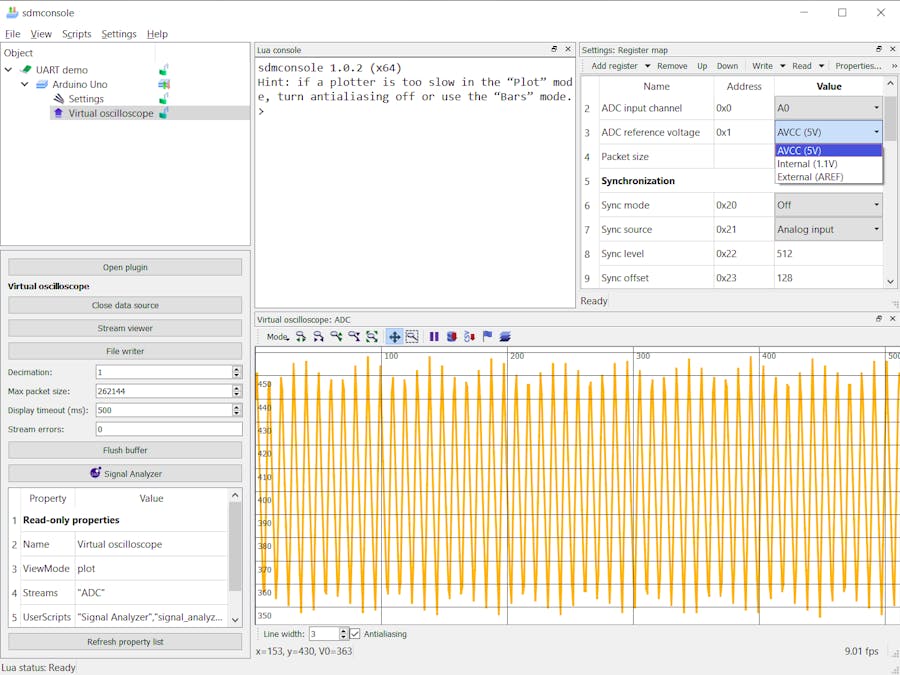
This project uses the on-chip ADC to capture and visualize a signal waveform. It supports different trigger modes (including external triggering), allows the user to select an analog input channel, reference voltage and control MCU pins. The PC application used for this project is based on the Simple Device Model open source platform (disclosure: I wrote it). It supports both Windows and Linux. The project was tested on an Arduino Uno board and may or may not work on other AVR-based Arduinos.
Note that with a sampling frequency of 4808 Hz, this project cannot be considered a replacement for a real oscilloscope.
Getting started1. Connect your Arduino to the computer with a USB cable and upload this sketch using the Arduino IDE. Note the name of the serial port used by the board (like COM3 on Windows, or /dev/ttyACM0 on Linux).
2. Download and install the Simple Device Model framework.
3. Launch sdmconsole, press the Open plugin button and select UART demo as a plugin and Arduino Uno as a device.
4. In the top-left area of the sdmconsole window, right-click on the Arduino Uno item and choose Connect. Enter the serial port name noted above.
5. The oscilloscope should now work on the A0 analog channel. If nothing is connected to it, you will probably see the 50 Hz mains interference (or 60 Hz, depending on where you live).
6. Connect digital pin 3 to analog input A0 with a wire. In the top-right area, set Pin 3 mode to PWM and Pin3 PWM value to 100. Double click on the viewport area to reset the scale. You should now see a rectangular PWM waveform:
7. If you want to get a smoother signal, put an RC circuit between the output and input. A ~100 kOhm resistor and ~1 uF ceramic capacitor will do the job.
Basic featuresIn the top-right settings panel, the ADC input channel and reference voltage can be selected. The built-in temperature sensor can be also set as an input channel. Note that this temperature sensor is not very accurate.
Packet size sets the number of samples in the displayed waveform. It also affects the refresh rate. For periodic signals, setting packet size to fit a whole number of periods will provide a better view, even without synchronization.
The Pin settings section allows you to set the state of pins 2-13 of the MCU. Possible states are Input, Input with pullup, Force low and Force high. Pins that support PWM (pulse-width modulation) can be also set to that mode.
Visualization modesIn additional to basic "oscilloscope" mode, sdmconsole can visualize data as a bar chart, image (where pixel brightness represents a sample value) or binary chart (where pixel brightness represents a single bit). The visualization mode can be changed with the Mode drop-down menu.
You can navigate around the viewport area by dragging it, change vertical scale with Ctrl+mouse wheel and horizontal scale with Ctrl+Shift+mouse wheel. Double click in the viewport area resets the scale to fit the entire image.
TriggeringSync mode sets the trigger mode: Off, Rising edge or Falling edge. By default, the oscilloscope is triggered by the same signal that is selected as the analog input. It can be also triggered by a digital pin by choosing it in the Sync source drop-down list.
When the analog input is used as a sync source, the oscilloscope will be triggered when the signal goes above or below the Sync level (depending on the sync edge). Sync level is ignored when a digital pin is used as a sync source.
Sync offset sets the number of samples before the trigger that will be displayed.
This trigger system is pretty basic and works reasonably well for single events and low frequency signals. For higher frequency signals, setting an appropriate packet size can sometimes provide better results.
Under the hoodTo provide a stable sampling frequency, the signal is sampled by putting the ADC into the free running mode where it constantly performs conversions and generates interrupts when data are ready. Only one of each two samples is used due to limited serial port throughput. This approach avoids the jitter which would be present if each conversion was initiated by the CPU.
The oscilloscope is controlled using its virtual address space: writing a value to a designated register address is interpreted as a command or configuration data. For example, writing 3 to the register address 0 selects the A3 analog input channel.
Serial port configuration is: 115200 baud, 8 data bits, 1 stop bit, no parity, no flow control.
The communication protocol uses four types of frames:
Write register (PC -> Arduino):
01010000 ADDR[7:0] DATA[7:0]
Read register (PC -> Arduino):
01010001 ADDR[7:0]
Register data (Arduino -> PC):
1000 DATA[7:4] 0000 DATA[3:0]
Stream data (Arduino -> PC):
11 SOP DATA[9:5] 000 DATA[4:0]
(SOP is a "start of frame" flag).
With this protocol, each sample needs just 2 bytes to be transmitted, while making it possible to differentiate between register and stream data frames.
On the PC side, the protocol is implemented by an uartdemo plugin that allows sdmconsole to communicate with the oscilloscope. Its sources are shipped with the SDM (in the examples directory). The plugin is written in C++ and implements functions that write and read register values and read stream data from the oscilloscope.
The simplest way to extend the oscilloscope feature set would be by modifying its virtual address space (that is, writeVirtualRegister and readVirtualRegister functions). Then, the new registers could be added to the register map which is fully user editable (but don't forget to save it). To change the communication protocol, you will also need to modify and recompile the uartdemo plugin sources.


_ztBMuBhMHo.jpg?auto=compress%2Cformat&w=48&h=48&fit=fill&bg=ffffff)


Comments
Please log in or sign up to comment.