This project builds on the WiFi Data Logger project I published a few weeks back. While that project focused on the hardware and firmware for the data logger, this one looks at the Internet of Things platform where data is stored, processed and displayed.
I plan on all sorts of applications for this device but, as a first use case, I wanted to build a GPS location logger that would only transmit data when its accelerometer sensed movement. Once it did, it would relay its location to Ubidots (my IOT platform of choice) where I could plot the path of the logger. Tonight, I brought my new “Thing” with me on my evening walk – using my iPhone WiFi hotspot to provide connectivity along the way.
Here are the steps you would take to create your own route map:
First, you will need to sign up for a Ubidots account, it is free and easy to do.
Next, you will need to generate a token for your account. Once you log in, click on your user name in the top right corner of the home page, and select “My Profile”. Then, select the “API Keys” option under settings on the right and press the create tokens (level or paranoia sets whether you go for the short key option). This is how Ubidots will know it is you or your “Thing” adding or deleting data in your account.
I created a “Source” called Teensy 3.1 for my WiFi logger as that is the micro controller powering the device.
You can see my sources here as well as the friendly button to add one if you need. Next, I had to tell Ubidots what type of variable to expect from my “Source” so, I created a “Variable” called samples.
This "Variable" was assigned a unique URL endpoint with a unique key. This key along with the authorization token for our user account to tell Ubidots where to store the data. The sketch provided in the project documentation takes care of this, all you need to do is insert your account and "Variable" identifiers at the top of the sketch.
When the data logger sends its updates, the samples count will be displayed in both graphical and tabular form on the "Variables" page for Samples. The data points can be exported to Excel using a drop down menu under the gear in the upper right hand side of the graph. Also, since each data point is date and time stamped, you don't need a real time clock on your device.
Notice, that each data point has a “context” with the GPS coordinates collected when the sample count was sent. Don’t worry about the formatting too much, the sketch takes the GPS coordinates in the format Adafruit’s library reports them and converts them to a format Ubidots understands. If you are interested, I went here when I was trying to figure this out.
The cool thing is that Ubidots will store this values and can display them in a number of ways on the “Dashboard” using widgets. And they are adding more and more widgets over time.
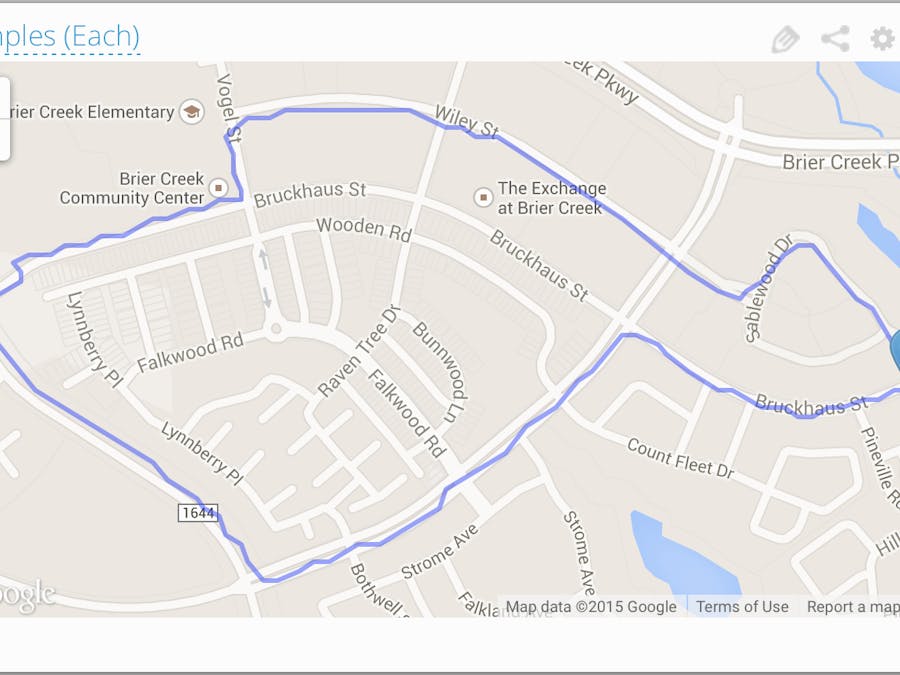
For this project, I selected the “GPS Trace”. As you can see below, this created a very accurate and complete record of my walk over 83 samples sent to Ubidots. You can very quickly experiment with other widgets to track the number of data points sent or to derive a value based on your variable.
If you want to make a clean GPS Trace as you see above, you will need to "trim" off some of the data points. Luckily, Ubidots gives you two ways to do this. For you command line types, you can use CURL commands which are documented in the API reference here. There is also now a simpler way to do this on the "Variables" page. Simply select the date / time range on the left and then click on the gear on the right to see the "Delete values" option drop down as in the picture below.
I hope you found this cool. I am looking forward to trying new


_3u05Tpwasz.png?auto=compress%2Cformat&w=40&h=40&fit=fillmax&bg=fff&dpr=2)
Comments
Please log in or sign up to comment.