As everyone experienced lately the biggest stress is provoked by not knowing what is going on. Not able to distinguish properly symptoms and developing fear in the people around and experience isolation.
MultiSenseCrown can help you put dots together and get a more insights on yourself and environment you live in and get faster remote medical support.
Indoor conditions influence the evolution of the disease
There is strong evidence for aerosols as an important mode of coronavirus transmission, most of which occurs indoors, and that indoor measures to slow the spread are often easily implemented at relatively low cost. The spread of aerosolized SARS-CoV-2, the virus that causes COVID-19, inside public buildings could be suppressed using engineering controls such as effective ventilation, possibly with air filtration and disinfection and avoidance of air re-circulation and overcrowding. [Source]
MultiSenseCrown is a proposal of telemedicine usecase while offering an all-in-one complete monitoring system for human vitals but also environmental conditions, follow the system architecture below:
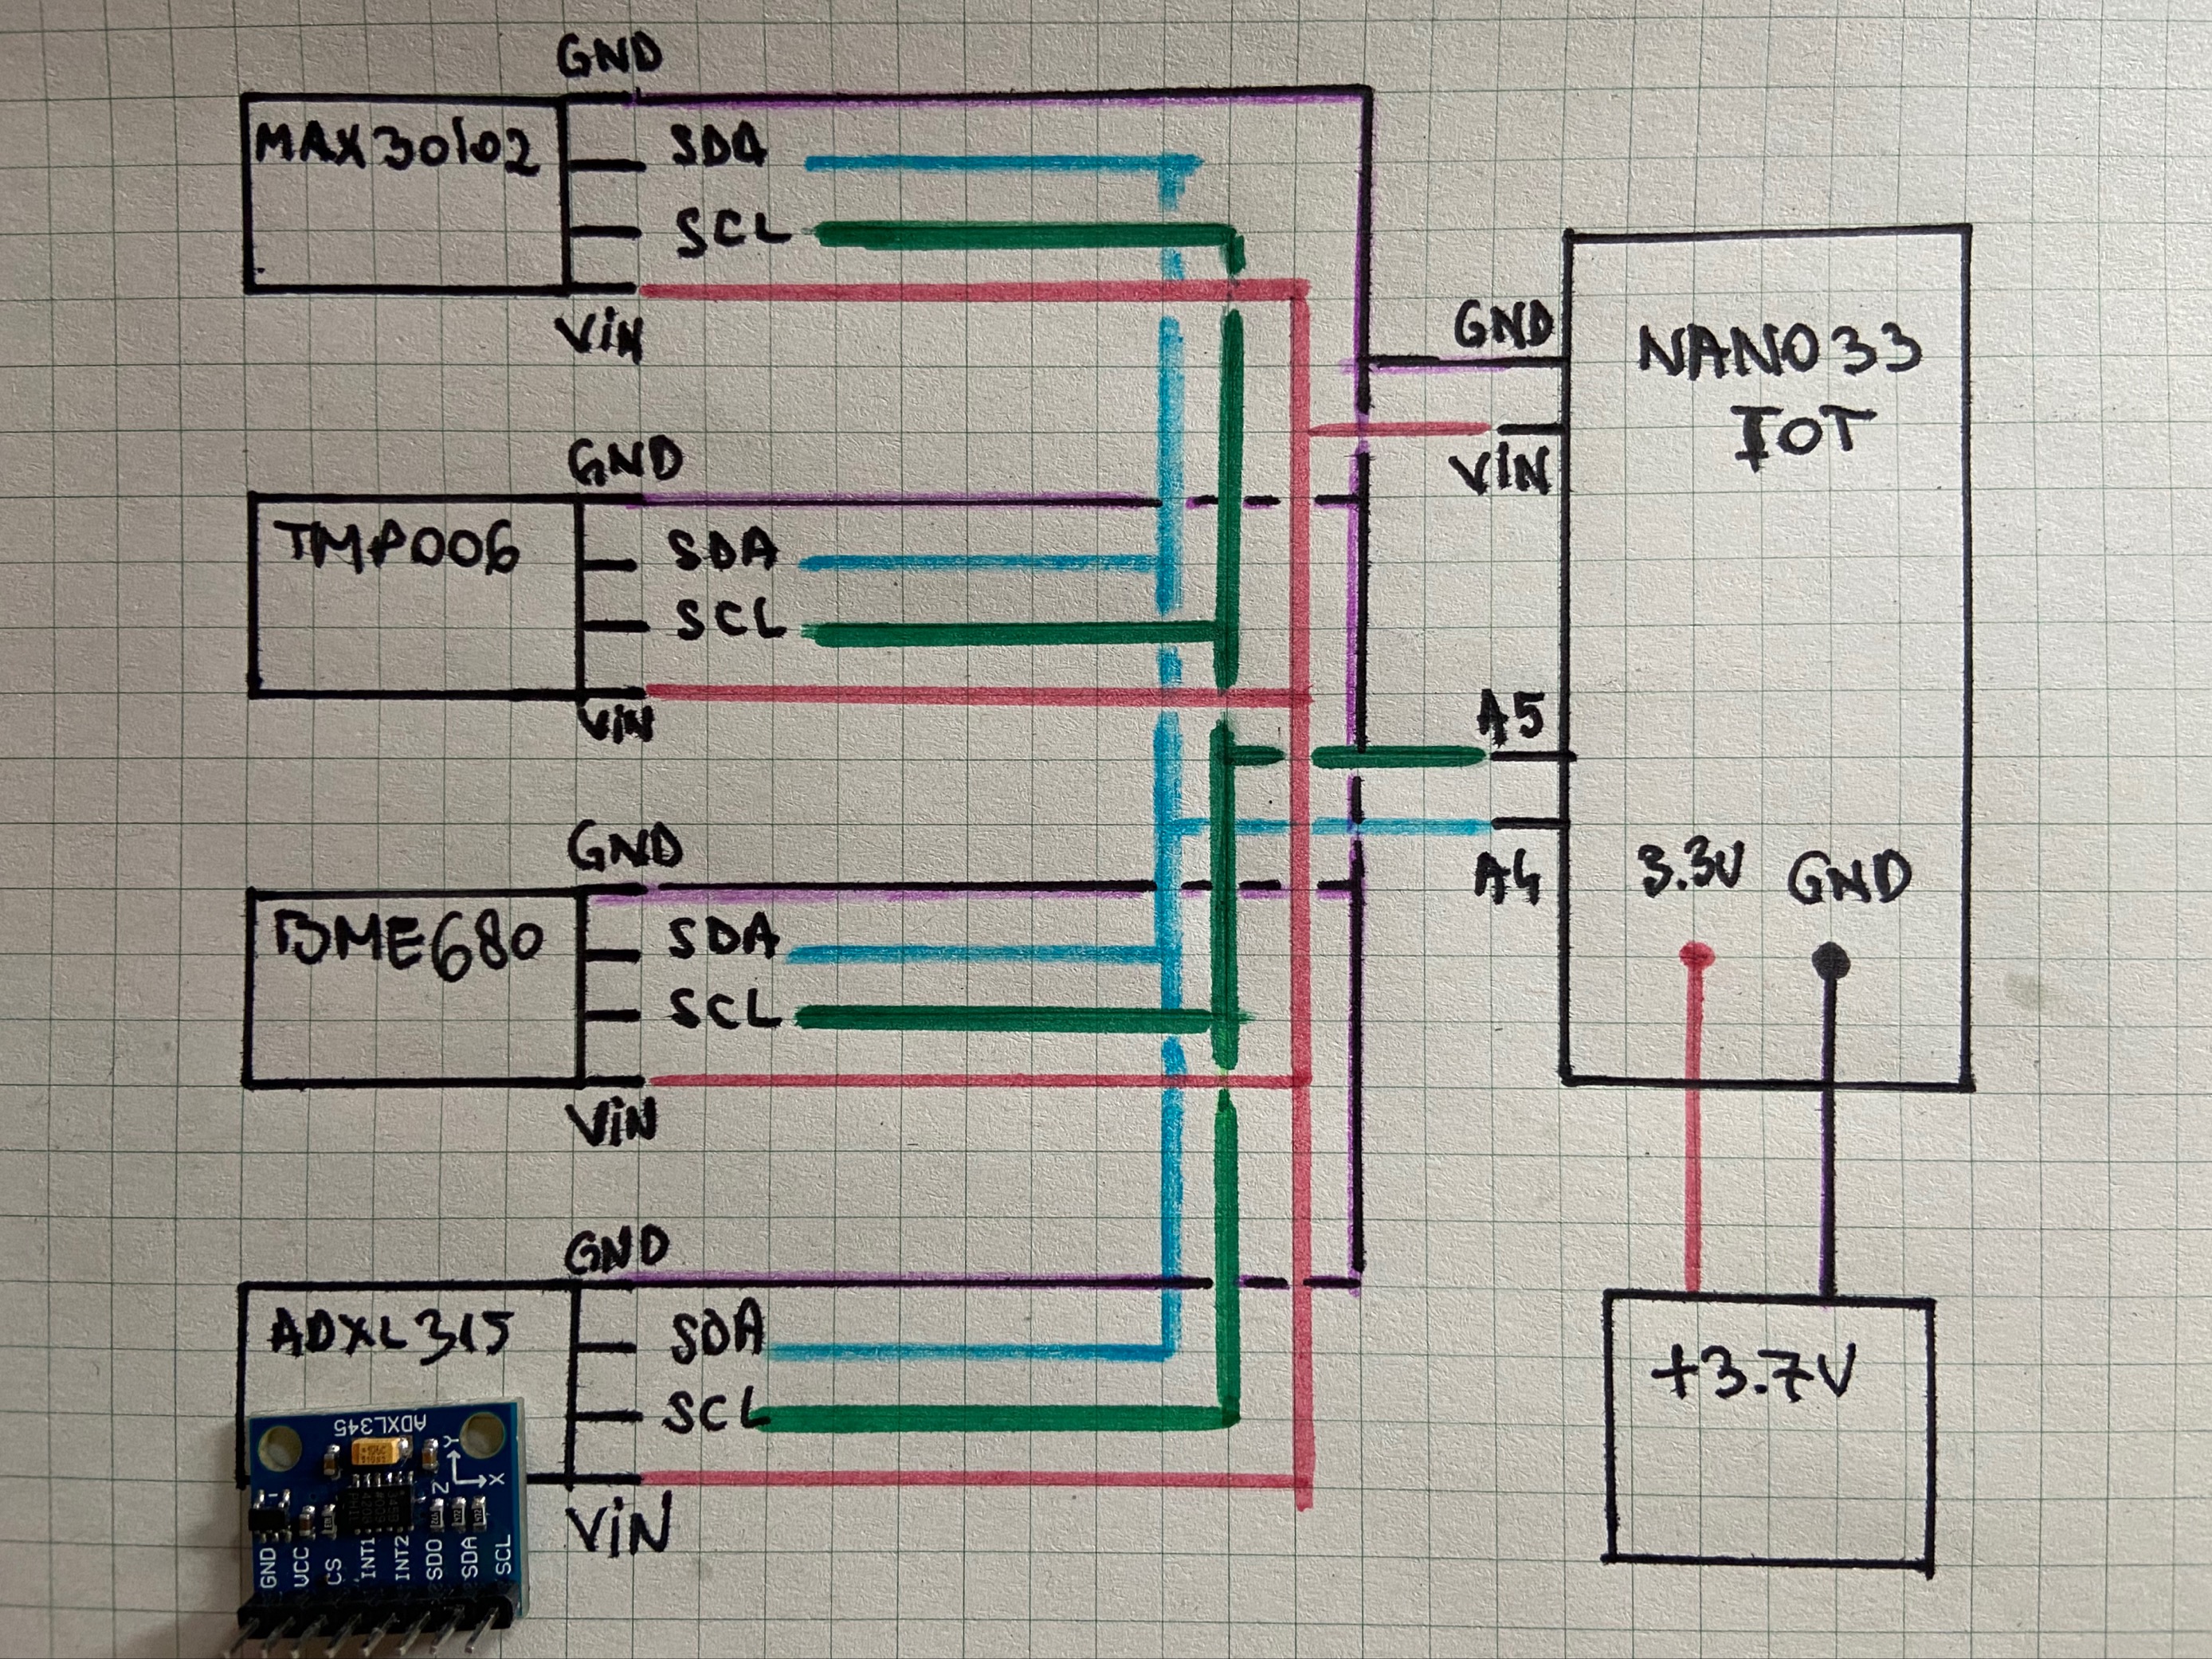
Human Vitals can be easily measured using sensors such as MAX30102 (Oxygen Saturation, Pulse) or TMP006 for Con-tactless Infrared Temperature
Indoor environmental conditions will be measured by the BME680 from BOSH (relative humidity, barometric pressure, ambient temperature and gas (VOC).
Accelerometer ADXL345 - Triple-Axis Accelerometer makes the best candidate for extending the capabilities of the wearable device in the fall detection scenarios
Having I2C made things connected a bit more easy while soldering on the same wires for SDA/SCL VIN/GND as shown below:
Minutes/ hours later after soldering and gluing things could look like this:
Don't 3D print unless is necessary you can find a hair holder in any retail store on women hair& beauty section for around 3 Eur.
Attach Battery: This wearable device should be also mobile, therefore we should add a battery. As it seems from the documentation "the Nano 33 IoT has no battery connector, nor charger. You can connect any external battery of your liking as long as you respect the voltage limits of the board."
After soldering this should look as below ground to GND (5) and 3.3V (1)
Going further on the software use Arduino IDE for your OS and add specific libraries for the previously described sensors & hardware, including connectivity for the Arduino Nano 33 IoT
Using the IDE, open the.ino file (thermal-tmp006-wifi.ino) from the source code provided in below.
#include <SPI.h>
#include <Wire.h>
#include <Adafruit_Sensor.h>
#include "Adafruit_TMP006.h"
#include <Adafruit_ADXL345_U.h>
#include "MAX30105.h"
#include "heartRate.h"
#include "Zanshin_BME680.h"
#include <WiFiNINA.h>
Wifi name, password and other data connectivity variables will be stored in the arduino_setup.h file
#include "arduino_setup.h"Please modify to your personal convenience for the wireless network and also data-storage. For the my convenience I used DasData playground as usual but you are free to host anywhere you like and feels secure.
//wifi
#define SECRET_SSID "WIFI_NAME_TOREPLACE"
#define SECRET_PASS "WIFI_PASS_TOREPLACE"


// dasdata storage
#define HOST "dasdata.co"
#define PORT 443

// dasdata keys user account / dataset
// register at www.dasdata.co
#define ATOKEN "ACCOUNT_USER_KEY_TOREPLACE"
#define DSTOKEN "DATASET_KEY_TOREPLACE"

// store sensors values every (milliseconds)
#define PERIOD  30000
Coming back to the.ino file (thermal-tmp006-wifi.ino), source code is self explanatory. Variables declaration followed by setup & initialization part.
String heatData;
Adafruit_TMP006 TempSensorData;
Adafruit_ADXL345_Unified accel = Adafruit_ADXL345_Unified(12345);

MAX30105 particleSensor;
long samplesTaken = 0; //Counter for calculating the Hz or read rate
long unblockedValue; //Average IR at power up
long startTime; //Used to calculate measurement rate
const byte RATE_SIZE = 4; //Increase this for more averaging. 4 is good.
byte rates[RATE_SIZE]; //Array of heart rates
byte rateSpot = 0;
long lastBeat = 0; //Time at which the last beat occurred

float beatsPerMinute;
int beatAvg;

int isHeadOn = 0;
String sensorData = ""; // this will be sent to datastorage
Further more in the loop method will execute getPresence(); that will activate the wearable and read the sensors send the your data. The presence are detected using MAX sensor and remembered in the application as isHeadOn
void getPresence() {
  samplesTaken++;
  long currentDelta = particleSensor.getIR() - unblockedValue;
  if (currentDelta > (long)100) { isHeadOn = 1;   Serial.print(" Something is there!"); }
   else {isHeadOn = 0;}
}
So if condition is confirmed (wearable is on) and measured temperature is over 35.5'C then get sensors data (follow the full source code) and prepare data as a string for storage. For convenience in proposed example sensors data will be delimited by vertical slash "|"
if (isHeadOn == 1 && bodytemp > 35.5) {
      sensorData += bodytemp + String("|"); // detected temperature
      Serial.print(" Detected Temperature: ");   Serial.print(bodytemp);   Serial.println("*C");
      sensorData += random(94,97) + String("|"); // OxygenSaturation
      sensorData += random(65, 133) + String("|"); // HeartRate
      sensorData += event.acceleration.x + String("|"); // acceleration X
      sensorData += event.acceleration.y + String("|"); // acceleration Y
      sensorData += event.acceleration.z + String("|"); // acceleration Z
      sensorData += "nano33" + String("|"); //  Medication - Notes
      sensorData += temp + String("|"); // Indoor_Temperature
      sensorData += humidity + String("|"); // Indoor_Humid
      sensorData += pressure + String("|"); // Indoor_AirQuality
      sensorData += gas + String("|"); // Indoor gas

      Serial.println("\nStarting connection to server...");
      // if you get a connection, report back via serial:
      if (client.connect(server, PORT)) {
      Serial.println("connected to server");
      // Make a HTTP request:
         sendData(String(sensorData));
        }
      client.println("Connection: close");
      client.println();
      setColor(0, 0, 0); // null
      delay(1000);
    }

    else { Serial.println("Stand by mode");  delay(5000);
      }
Sending data
void sendData(String sensorData) {
    String data = "";
    data += "/i.aspx?d=";
    data += sensorData;
    data += "&s=";
    data += DSTOKEN;
    data += "&a=";
    data += ATOKEN;

    String request = "POST ";
    request += data;
    request += " HTTP/1.1\r\nHost: ";
    request += HOST;
    request += "\r\n\r\n";

    Serial.print (req);
    Serial.println(request ); // Check if sent
    client.println(request);
    delay(300);
  }
As all things connected and code was uploaded without too many errors, this should be stored and look like this. Temperature and the sensor requires more calibration tho.
Data storage can be solved with some simple steps.
1. Clone dataset structure
2. Add your Microsoft Live/ Outlook account
3. Voila! On right side will find the keys to update on your Arduino code.
Be sure to put the sensors on side of the plastic band. Actually there is a bit of space just for that because head and plastic band circular form (as notice on left side).
As participating to several hackathons these days, I learned from medical competent sources, that normal levels of blood oxygen fall in the 95% to 100% range, while a measurement of 90% or less warrants a consultation with a doctor.
Continuous monitoring can give you more insights also on the asymptomatic conditions based on the evolution of the SO2 values.
- Body Temperature: < 37'C is Normal and > of 37.'5/38'C then Fever
- SO2: < 93% hospitalization < 97% warning
- Normal ECG: <- Monitoring Medication can influence the patient condition.
Medication can also influence the way the monitoring conditions are evolving. Therefore all this data can be also updated manually (as default in DasData platform) into a form using mobile /tablet device for instance.
Medication list based on the manual form updates with patient ID association.
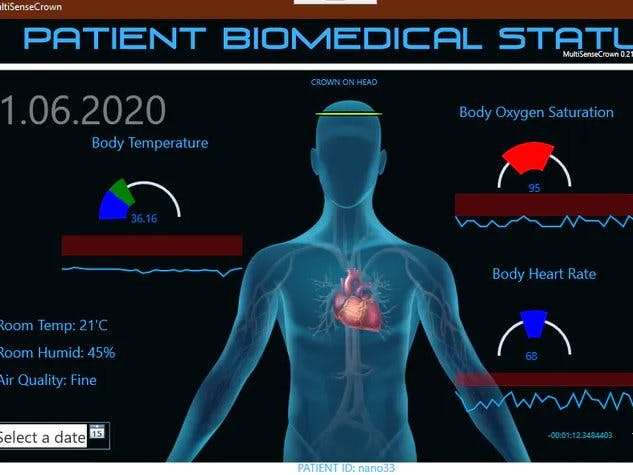
I've been chosen WPF for medical interface because of the "visually stunning user experiences" for the desktop client applications in Windows, but then again you can select your preferred presentation interface. Doctors will need some insights with a basic trend visualization of 3/4 different daily measurements on last 7 days.
We will connect to the json data stream in two ways: by interval and latest values.
string _urldata = "";
 if (_type == "interval") {
 _urldata = _domain + "/e.aspx?json=1&dfrom=" + _from + "&dto=" + _to + _dasToken;
       }
 else if (_type == "latest") {
 _urldata = _domain + "/e.aspx?json=1&from=" + _from + "&to=" + _to + _dasToken;                     }
Data will be transported into a datatable so we can easily adapted accordingly to our need, latest value in the also for the trends.
DataSet dataSet = JsonConvert.DeserializeObject<DataSet>(responseFromServer);
DataTable dataTable = dataSet.Tables[0];
dataTable.DefaultView.Sort = "id ASC";
dataTable = dataTable.DefaultView.ToTable(); // rearange to the latest for chartlines
DataColumnCollection columns = dataTable.Columns;
BodyData = new ObservableCollection<BodyTemp>();
OxyData = new ObservableCollection<OxygenSaturation>();
HeartData = new ObservableCollection<BodyPulse>();
If MultiSenseCrown is not or on the patient head then we display it on the screen
DateTime now = DateTime.Now;
DateTime updated =   DateTime.Parse(row[column].ToString()).AddHours(-1); // server time is -1 hour CET
TimeSpan updatespan = now.Subtract(updated);
TimeSpan e5sec = TimeSpan.FromSeconds(5.0);
    if (updatespan < e5sec)  {  lblStatusCrown.Content = "CROWN ON HEAD";  crownSign.Visibility = Visibility.Visible; imgHuman.Opacity = 1;  }
    else { lblStatusCrown.Content = "CROWN NOT MOUNTED"; crownSign.Visibility = Visibility.Hidden;  imgHuman.Opacity = 0.8;  }
For data visualization was completed by using components from Syncfusion
SparkGridOxygen.Children.Clear();
SfLineSparkline sparklineOxy = new SfLineSparkline()
      {
         ItemsSource = OxyData,
         YBindingPath = "OxygenVal",
         BandRangeStart = 90,
         BandRangeEnd = 94,
         RangeBandBrush = new SolidColorBrush(Colors.Red),
         MaximumYValue = 90,
         MinimumYValue = 100
      };
this.SparkGridOxygen.Children.Add(sparklineOxy);
You can follow all the data binding in the C# sample code below.
AI on the EdgeAnother interesting follow-up would be to model it in order to deploy some basic models using latest TinyML.
For modeling you can send data directly from your device to EdgeImpulse in order to train the models. Anomaly detection is the perfect case scenario for enable the fall detection using data from accelerometer sensor.
After all the training you can deploy to the device the model and set the coordinates in the code as in the provided samples.
Edge Impulse enables developers to create the next generation of intelligent device solutions with embedded Machine Learning: https://edgeimpulse.com/
Final ThoughtsMultiSenseCrown goal is to flatten the curve by breaking the disease distribution network effect while staying out of risk for patients and medical personnel.
Freeing hospital resources: during pandemic there is a lack of beds and gear, if not severe conditions patients can be monitored remotely from home.
Direct contact people/medical: shortage of protective gear makes physical contact highly risk for medical stuff and further virus spread
More patients can be monitored in less time: having a remote monitoring system vital signs can be easily measured and instantly notified on anomalies.
Surely you can allocate billions of dollars in high crisis but this won't solve a broken health system by magic, MultiSenseCrown is an example of affordable telemedicine offering an all-in-one complete monitoring system for human vitals but also environmental conditions.


_1x_bGT19vVAby.png?auto=compress%2Cformat&w=40&h=40&fit=fillmax&bg=fff&dpr=2)


Comments
Please log in or sign up to comment.