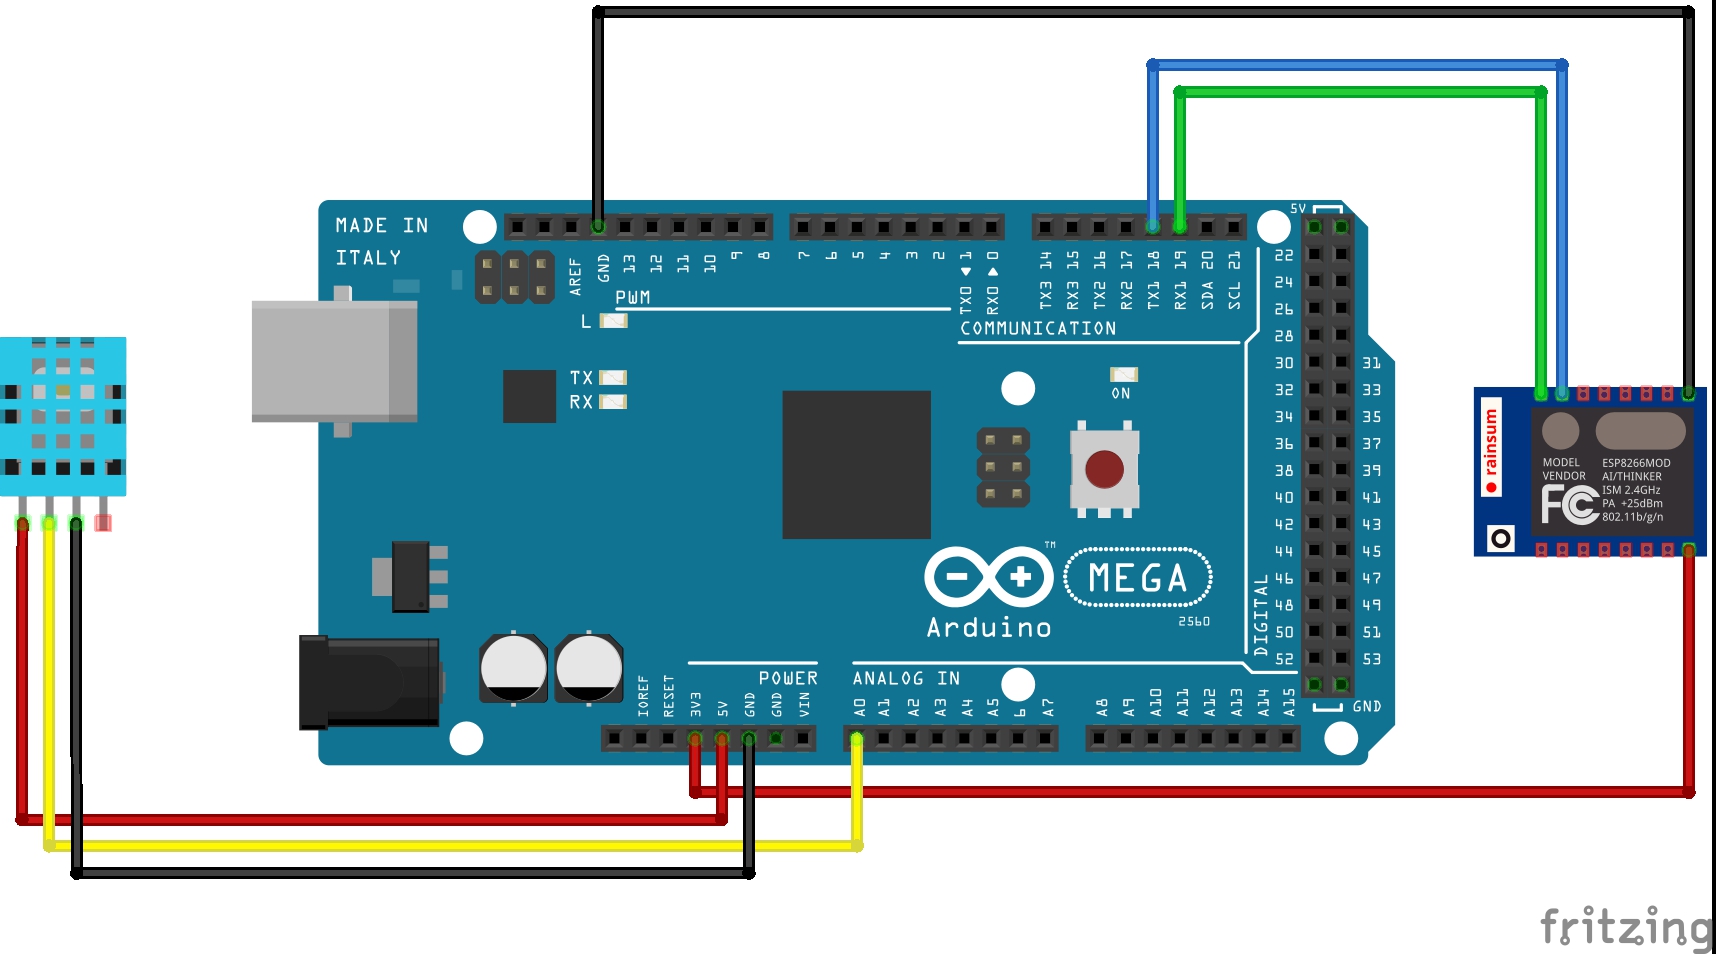
In this project, with the help of Blynk IoT solutions, we will be able to monitor conditions over the Internet. This project works for both Private Networks and Public Networks.
The Project Cover is actually a Time Lapse of Temperature Drop after I turn on my Air Conditioner for about 30 mins on full power.
If you want to make your own Blynk Local Server to enjoy Unlimited Energy and Low Latency then refer to this tutorial : https://create.arduino.cc/projecthub/devansh_tangri/how-to-make-your-own-blynk-server-2dca48?ref=user&ref_id=1856055&offset=0
Step 1 :
Use the code given below to program your Arduino which is going to compute data from the Temperature Sensor (DHT11).
We need to Flash the ESP8266 with AT Commands which makes ESP8266 as a Interface medium between General Arduino and the Blynk app over your Network.
Download the ESP8266 Flasher from : https://drive.google.com/file/d/0B3dUKfqzZnlwVGc1YnFyUjgxelE/view?resourcekey=0-6ZM6kHn9wpw-G-sqiA1PlA
Download your specific AT Commands bin file : https://github.com/Edragon/esp_firmware/tree/master/Firmware/AT-other/AI-THINKER/At_firmware_bin1.54
Step 2 :
Open ESP Flasher
Click the 'bin' button and locate the AT Commands bin file, use the COM port on which ESP8266 is connected or to which your FTDI breakout board is connected.
Step 3 :
Create a new Blynk Project and find your Authentication Token from the app or from the Server Properties Page if you own a Blynk Local Server.
In the Users Tab, select the username displayed and scroll down to find the Token
Use this token for the BLYNK_AUTH_TOKEN variable on line 1 in the code
Ex :
#define BLYNK_AUTH_TOKEN            "FQG2MTljldI0vsuoNKZi-zASlYBCfvny"
Step 4 :
We can use SuperChart widget in the Blynk App where you can plot the data over a vast period of time.


_ztBMuBhMHo.jpg?auto=compress%2Cformat&w=48&h=48&fit=fill&bg=ffffff)


Comments
Please log in or sign up to comment.