


COVID predict is a desktop application that predicts the demographic future of covid19 disease by giving the number of people susceptible, infected, recovered, and likely to die of the covid19 disease in a time frame of 60 days. This application uses a python algorithm that mimics the mathematical SIR (susceptible, infected, and removed) ordinary differential equation model that has been to model and predict fate highly infectious pandemics in the past like smallpox and measles. With limited capacity to test for the disease, low resource countries like Uganda can use mathematical predictions (given by this app) to assess and track the spread of coronavirus in different regions of the country where there are scientifically confirmed cases of community transmission. This app can guide research and government (task force) actions in regions of the country, the authorities can use this mathematical data to increase testing abilities, enforce or lift lockdowns and study trends and curve of the disease in 60 days. Hence the application can guide community awareness and prepare for the near pandemic future.
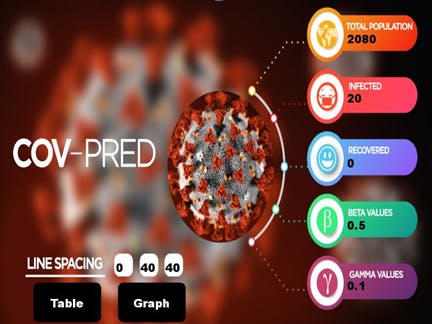
The software utilizes 6 main parameters as shown in the figure above, the total population of a given area i.e. district or town, the population demographics based on the age the number of infected people before computation, the number of recovered individual, the current rate of infection of the epidemic as observed from other existing affected regions, the rate of recovery and the number of days for which the prediction is to be done.
The inspiration to do this project was picked from an Asian country south Korea which heavily relied on mathematical predictions to make key decisions and build capacity to fight the deadly pandemic. To date, South Korea has been ranked among countries that have performed very well to fight the pandemic despite it having borders with china. The team hence decided to adopt the same strategy by designing this app which can be used as a basis by policymakers and epidemiologists to make key decisions concerning the fight against the disease. Our own country being poor means that there are low testing abilities with an average of 2000 tests a day which is below the average, so we have designed this App as our social cooperate responsibility as data scientists to our country and other developing countries during this hard-pandemic time.
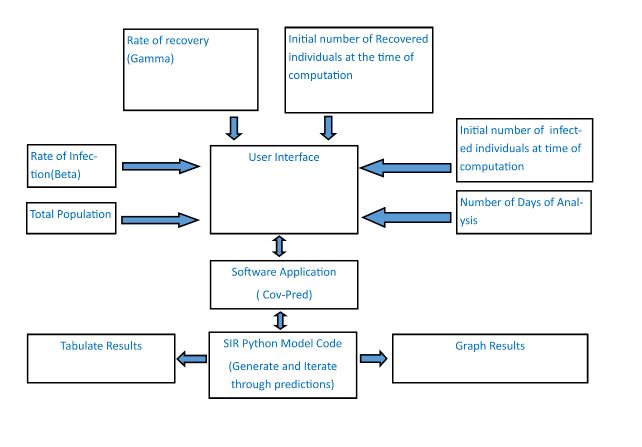
The desktop application was developed using open-source software tools. It was designed in line with the agile software development lifecycle. This ensured a timely software modification during the development process. Requirements analysis was done for the software to establish both functional and non-functional requirements. The software uses python as the core programming language. This enables us to take advantage of the vast collection of python's open-source libraries which are described below, matplotlib that is used to generate graphical representations of data predictions based on the SIR epidemic model. The Scipy library is used to calculate the predictions based on ordinary differential equations. The Tkinter and kivy libraries are used to construct a user-friendly interface with the software through which inputs are subjected to the software which can then use to compute the predictions of the number of people based on demographics.
The software utilizes 6 main parameters as shown in the figure above, the total population of a given area i.e. district or town, the population demographics based on the age the number of infected people before computation, the number of recovered individuals, the current rate of infection (beta values) of the epidemic as observed from other existing affected regions, the rate of recovery (gamma values) and the desired prediction time (0 to 60 days) which is on the scale.
To use this App one will have to download the application from the internet following our GitHub link and install it on their computer. Inputs should be made, where the rate of infection and rate of recoveries should be obtained from regional data calculated by epidemiologists from the previously confirmed cases, among others
With the application on the Desktop, the users input the number of people in the desired region, rate of infection, and rate of recovery given by epidemiologists in that region, the number of confirmed infections in that region, and people who have recovered. By pressing tables or graphs the desktop application can predict up to 40 days of possible infections, deaths, and recoveries that can be recorded. The App also generates epidemiological curves that show the expected trend of infections, deaths, susceptibility, and recoveries for forty days. We believe that this information is very helpful in accurate mathematical planning for the future.
This application is being used in Uganda and results produced are linearly accurate compared with the government tests carried out in a region called kyotera in the country as shown in the figure below.
Video link for the project:https://drive.google.com/file/d/16K5qdoDSDHQLpiEfJnQci_QvGcOdmJis/view
This application is being used in Uganda and results produced are linearly accurate compared with the government tests carried out in a region called kyotera in the country as shown in the figure below.
¡���


Comments
Please log in or sign up to comment.