Get a live feed of number of cases, deaths, and recoveries of the coronavirus in the world displayed on an OLED screen using the raspberry pi.
SetupFrom your raspberry pi's desktop click the raspberry pi icon in the top-left of the screen.
Then click on interfaces and enable I2C.
Open the terminal and install the necessary packages. (Please let me know if there are any I missed.)
sudo apt-get install build-essential python-dev python-pip
sudo apt-get install python-imaging python-smbus
sudo python -m pip install --upgrade pip setuptools wheel
sudo pip install Adafruit-SSD1306
Clone this repo.
git clone https://github.com/gadhagod/Live-Coronavirus-UpdaterHere is an overview of important parts of the code.
backend.py
Open backend.py
nano backend.pyData is retrieved from SimpleCovidAPI.
data = loads(requests.get('https://simplecovidapi.herokuapp.com/').text)Then it returns each json object as a variable:.
return data['cases'], data['deaths'], data['recoveries']To stop viewing backend.py hit control+x
main.py
Open OLEDVersion.py
nano OLEDVersion.pymain.py line 37:
font = ImageFont.load_default()This will set the font to the default font. You edit this to your preferences.
main.py line 40:
draw.rectangle((0,0,width,height), outline=0, fill=0)The line above clears the screen by filling it with a black rectangle.
main.py line 42:
cases1, deaths1, recoveries1 = backend.global_data.data_return()This stores the number of cases, deaths and recoveries from backend.py into a 3 variables.
main.py line 50:
draw.text((x, top+20), recoveries1, font=font, fill=255)The first argument sets the coordinates to write to. The second is what to write. The third argument sets the font and the last sets the fill of the text.
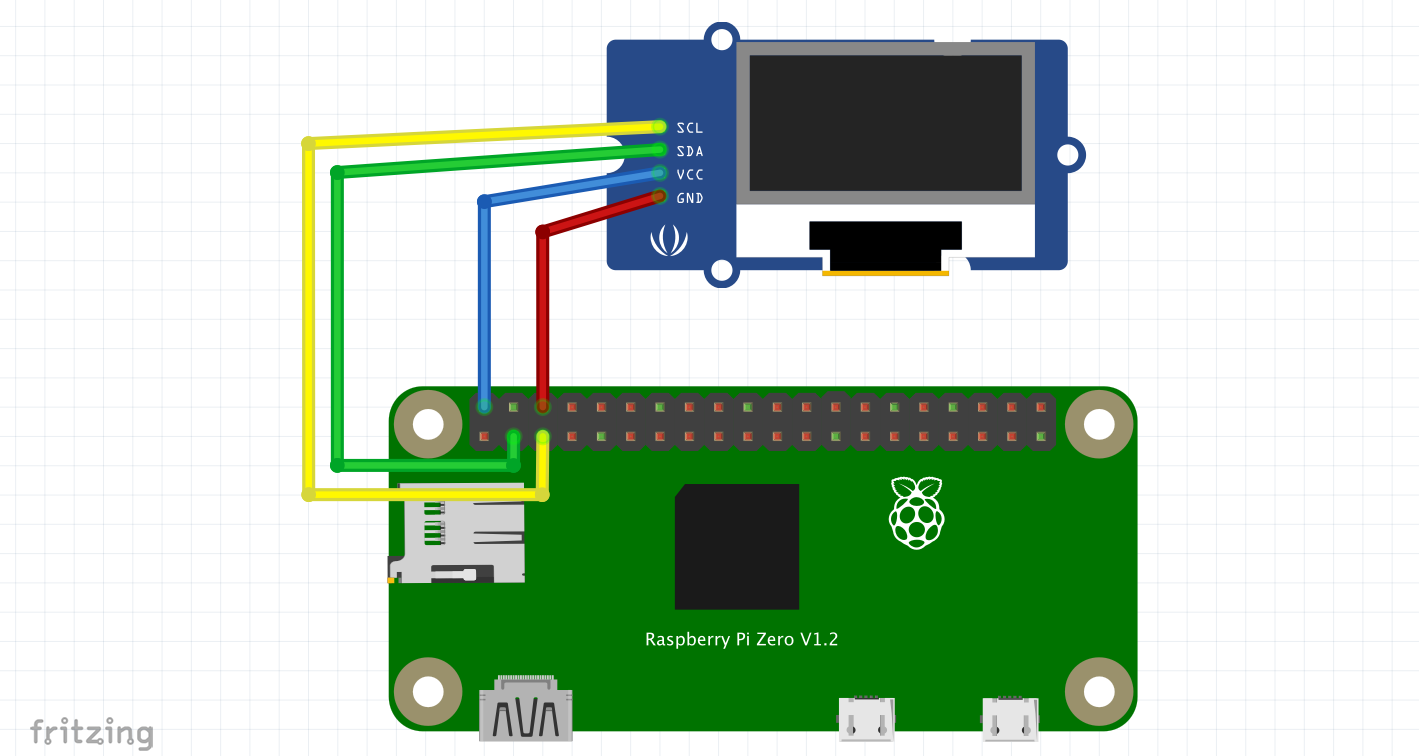
ConnectionsThe connections are very simple. Since the OLED is works with I2C, we use the SDA and SCL pins.
VCC - 5V
GND - GND
SDA - Pin 2
SCL - Pin 3
A schematic is below.
Post any questions or bugs. Hopefully I won't be needing a bigger display.


Comments
Please log in or sign up to comment.