


Hardware components | ||||||
 |
| × | 1 | |||
Software apps and online services | ||||||
| ||||||
| ||||||
 |
| |||||
Following on from the first post in which we covered setting up IBM Bluemix, Watson IoT service, we will now go to the next step. In this part we will setup the Raspberry Pi, design an application in Node-RED to send temperature of the CPU in Pi and visualize the temperature data in IBM Bluemix.
If you haven’t gone through the first part, read it and then come back here. There are again 3 tasks to do to complete the exercise.
What is Node-RED?Let’s begin with a quick short introduction to Node-RED. Node-RED is a tool for visually wiring together various entities in your system. These entities may include hardware devices like sensors or actuators, APIs, online services, social media services etc. It provides very easy interface and tools to draw a system architecture and get things running quickly.
Introduction to Raspberry Pi should not be needed as there is ample material available on the web. In fact if you are new to Raspberry Pi then getting into IBM Bluemix, watson may be an overkill for you.
Set up Raspberry PiI assume that your Raspberry Pi is up and running. Please use resources available on the web if you need help. Raspbian Jessie from November 2015 onwards has Node-RED pre-installed. If not, install Node-RED by running the commands below.
sudo apt-get update
sudo apt-get install nodered
Once Node-RED is installed, start it by running the command as below.
node-red-start

Started Node-RED graphical event wiring tool..Welcome to Node-RED===================27Dec 10:40:27
- [info] Node-RED version: v0.15.227 Dec 10:40:27
- [info] Node.js version: v4.7.027 Dec 10:40:27
- [info] Linux 4.4.11+ arm LE27 Dec 10:40:45
- [info] Loading palette nodespi : TTY=unknown ; PWD=/home/pi ; USER=root ; COMMAND=/usr/bin/python -u /usr/lib/node_modules/node-red/nodes/core/hardware/nrgpio.py infopam_unix(sudo:session): session opened for user root by (uid=0)pam_unix(sudo:session): session closed for user root27 Dec 10:42:20
- [warn] [serialport] ReferenceError: namespae is not defined27 Dec 10:42:20
- [info] Settings file : /home/pi/.node-red/settings.js27 Dec 10:42:20
- [info] User directory : /home/pi/.node-red27 Dec 10:42:20
- [info] Flows file : /home/pi/.node-red/flows.json27 Dec 10:42:21
- [info] Server now running at http://127.0.0.1:1880/27 Dec 10:42:22
- [info] Starting flows
This will start Node-RED. It takes a few seconds to start.
Node-RED is a web browser based tool. Note that Node-RED starts a server on your pi on port 1880. Once Node-RED has started, point a browser at http://127.0.0.1:1880 On the Pi Node-RED works better with the Firefox browser.
Use node-red-stop
to stop Node-RED. You can use additionally the following commands:
sudo systemctl enable nodered.service
to autostart Node-RED at every boot. Use:
sudo systemctl disable
to disable autostart on boot.
To find more nodes and example flows - go to http://flows.nodered.org
If you need to upgrade the Node-RED installation or need some help related to Node-RED, refer this link.
Introduction to Node-REDThe designs we do in Node-RED are called flows. When Node-RED starts for the first time, a blank flow is displayed named “Flow 1”. You can rename this flow. You can also can add more flows by clicking on the “+” button in the flows tab. The flows are automatically saved to a default json file. Flows can be imported just by copy / paste as well.
On the left hand side you can see various nodes. Hover your mouse on any node and a brief is displayed about it. If you click on the node you can see detailed information about it on the right hand side in “info” section. To use the node in your flow, drag and drop it on the flow. Double clicking a node use in flow shows you the configuration of the node and you can edit it. Finally, wire the nodes together and click on “Deploy” button on the right hand side in upper corner. This deploys the Node-RED flow and the program (flow) starts executing.
Node-RED interface
At this stage your Raspberry Pi is setup so let’s go ahead and create a flow in Node-RED.
Design a Node-RED appOur objective is to send some data from Raspberry Pi. To keep it simple, let’s send the temperature of Raspberry Pi CPU to Watson. The Pi SOC has an in-built temperature sensor which measures the temperature of the SOC core. It can be obtained from a command line utility by running the following command. We will use this command in our Node-RED flow.
vcgencmd measure_temp
First, we need a trigger to execute this command. So we will add an input node. This node is like a virtual button. Drag and drop the inject node from “input” section of nodes. It will show as a ‘timestamp’ node.
Double click on the node to set its properties. Change the payload type from default timestamp value to boolean type. Leave the payload value to True. Give some meaningful name to node such as “Trigger”.
Next we need a node to execute the command vcgencmd on Pi. Drag and drop the “exec” node from “advanced” section of nodes. This node can execute any command on the Pi command line. It outputs the value returned by the command. Double click on the node and change its properties. Add the command to execute as “vcgencmd” and its parameter as “measure_temp”. Deselect the checkbox Append to msg.payload. Also leave the checkbox “Use spawn() instead of exec()?” unchecked. Give some meaningful name to the node such as “getTemp”.
We need to send data to Watson IoT platform in json format. To convert the data returned by earlier command from string to json, we need a line of code. We also need to get only the temperature value and remove unwanted characters from the command output. This is achieved by the function node. Drag this node from “function” category. In the “function” text box, replace the code line “return msg;” to the following two lines.
12msg.payload = {"d":{"temp":msg.payload.replace("temp=","").replace("'C\n","")}};return msg;
The first line replaces strings “temp=” and “C” with a blank character, thus leaving only the temperature value in the msg object. Second line just returns the msg object as an output from this node. Your completed function node should look like this.
Next we need a node that takes the value from the earlier function node and sends it out to the Watson IoT platform. Drag and drop the “Watson IoT” node in the “output” section of nodes and not the “input” section. Double click on the node to open its configuration. Leave the “Connect as” to “Device”. If you remember, we created a device on the Watson IoT platform and not Gateway.
Now we need to add device credentials generated during the Watson setup. Tick the radio button “Registered” instead of “Quickstart” since we have already registered our device on Watson platform. Click on the edit icon in credentials which says “Add new wiotp credentials”. Enter details of organization, device type, device ID and auth token. Remember that we copied these credentials in the 1st part of this post. Give a name to this set of credentials, say “Raspi-1 credentials”. Be careful to add all details correct, especially the device token. Always copy and paste the token instead of manually typing it out to avoid any chances of typo error. It is based on these credentials that the IBM Watson platform is able to authenticate data coming from our device. Click on “Add” button and it will take you back to the node configuration dialog.
On the “Edit Watson IoT node” screen, leave the event type as ‘event’ and format as ‘json’. Give some name as “Send to Watson”. The completed node configuration for Watson IoT node should look like this.
One last node, though not required for functioning is a debug node. This is useful to see what message is being sent from the device. Drag and drop the “debug” node from “output” section of nodes. No configuration changes need to be done for this node.
We should now have total 5 nodes as below.
All nodes are now added and configured. Wire them together like shown below. Wiring is simple, just drag your mouse from the output of one node to the input of next node. Some nodes have more than one output. Read the information about that node to find out which output represents what data. For our exec node (getTemp), there are 3 outputs. Wire the 1st output only (uppermost) as it represents stdout. The other two outputs are stderr and return code. Also note that output from the function node is going to both Watson IoT node and the debug node as well. This will print the data being sent to Watson platform in the debug node. Here is the completed wiring.
Finally, click on the Deploy button. You should see some messages like “Successfully deployed”. After a while, the “Send to Watson” node should show status as “Connected”. Now if you click on the button icon on “Trigger” node, the temperature of Pi should get sent to Watson. You should see message “Successfully injected” and also the temperature should be shown in the debug tab on right hand side. Give it a try.
At this stage we can view this data in Watson platform. But before that let’s now configure this app to send this temperature data periodically. Double click on the “Trigger” node and set the repeat interval to 10 seconds as shown below. This will send the trigger to further nodes every 10 seconds and thus send the temperature data to Watson every 10 seconds. Click on “Done” and then click on “Deploy” button.
Remember that any change you do to the Node-RED flow must be followed by depolying the changes to be effective.
You can see in debug tab that the data is being sent every 10 seconds. At this point your Raspberry Pi is successfully sending its temperature data to IBM Watson. Let’s turn back to Watson to see this data.
I have uploaded the flow on github so you can even import the entire flow by copying this file and importing it from the Node-RED menu (upper right corner).
View your Pi data in IBM BluemixLog in to the Bluemix platform if not already and click on the service you created earlier.
This should take you to the Watson IoT platform welcome screen. Click on “Launch dashboard” from the column “Connect your devices”. You should see this screen with various boards there. Refer the earlier post if required.
Click on the board “Device-Centric Analytics”.
You will see various cards on the screen. “Devices I care about” card will show the list of devices you added. “Device info” card shows information about the device selected in the “Devices I care about” card. Ignore the rule alert related cards for now.
Let’s add our own card which shows a line graph of the temperature we are sending from our Pi. Click on the button “_Add New Card”. On the screen that pops up, there are various types of charts and other options. Select the “Line chart”.
You will have to fill in a few details for creating the line chart. Select the category “Devices” instead of “Cards” and then select the device you added. Click on “Next” button.
Expand the “Connect new data set” by clicking on the ‘+’ button as shown. It will expand asking you to select the data for which the line chart is to be populated. The data is based on events received from the device.Remember that we are sending the ‘temp’ data from our Node-RED application in json format. The key in that data is ‘temp’ which is shown in the property drop down on this screen. Select the property as temp. Next, give some meaningful name “SOC Temperature” which appears on the graph. Ensure the type of data is Float. You can select the precision and the range of data.
Click on “Next” button. You can select the type of chart here such as line chart, bar chart, donut chart etc. You can also select size of the chart as Small or Medium or Large etc. Keep the selection of line chart and size to Small. Click on “Next”. On the next screen, you can select colour of the chart.
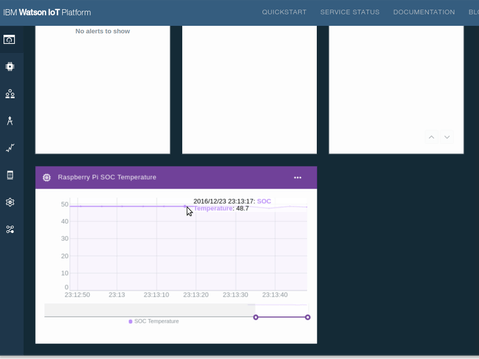
Finally, click on “Submit” button and your chart is ready for viewing.
The chart will be updated with received data in real time. Since the temperature data is relatively constant, you will see almost a straight line.
Congratulations ! Finally you have succeeded in sending data from Raspberry Pi to IBM Watson IoT platform and monitoring the data in real time.
Go on exploring other types of charts and cards. You can also try sending other data like number of processes from the Pi instead of temperature.
In the upcoming posts we will explore how Watson can send data back to the Pi. Do let me know if this blog post has helped you or if you have any questions / suggestions.


Comments
Please log in or sign up to comment.