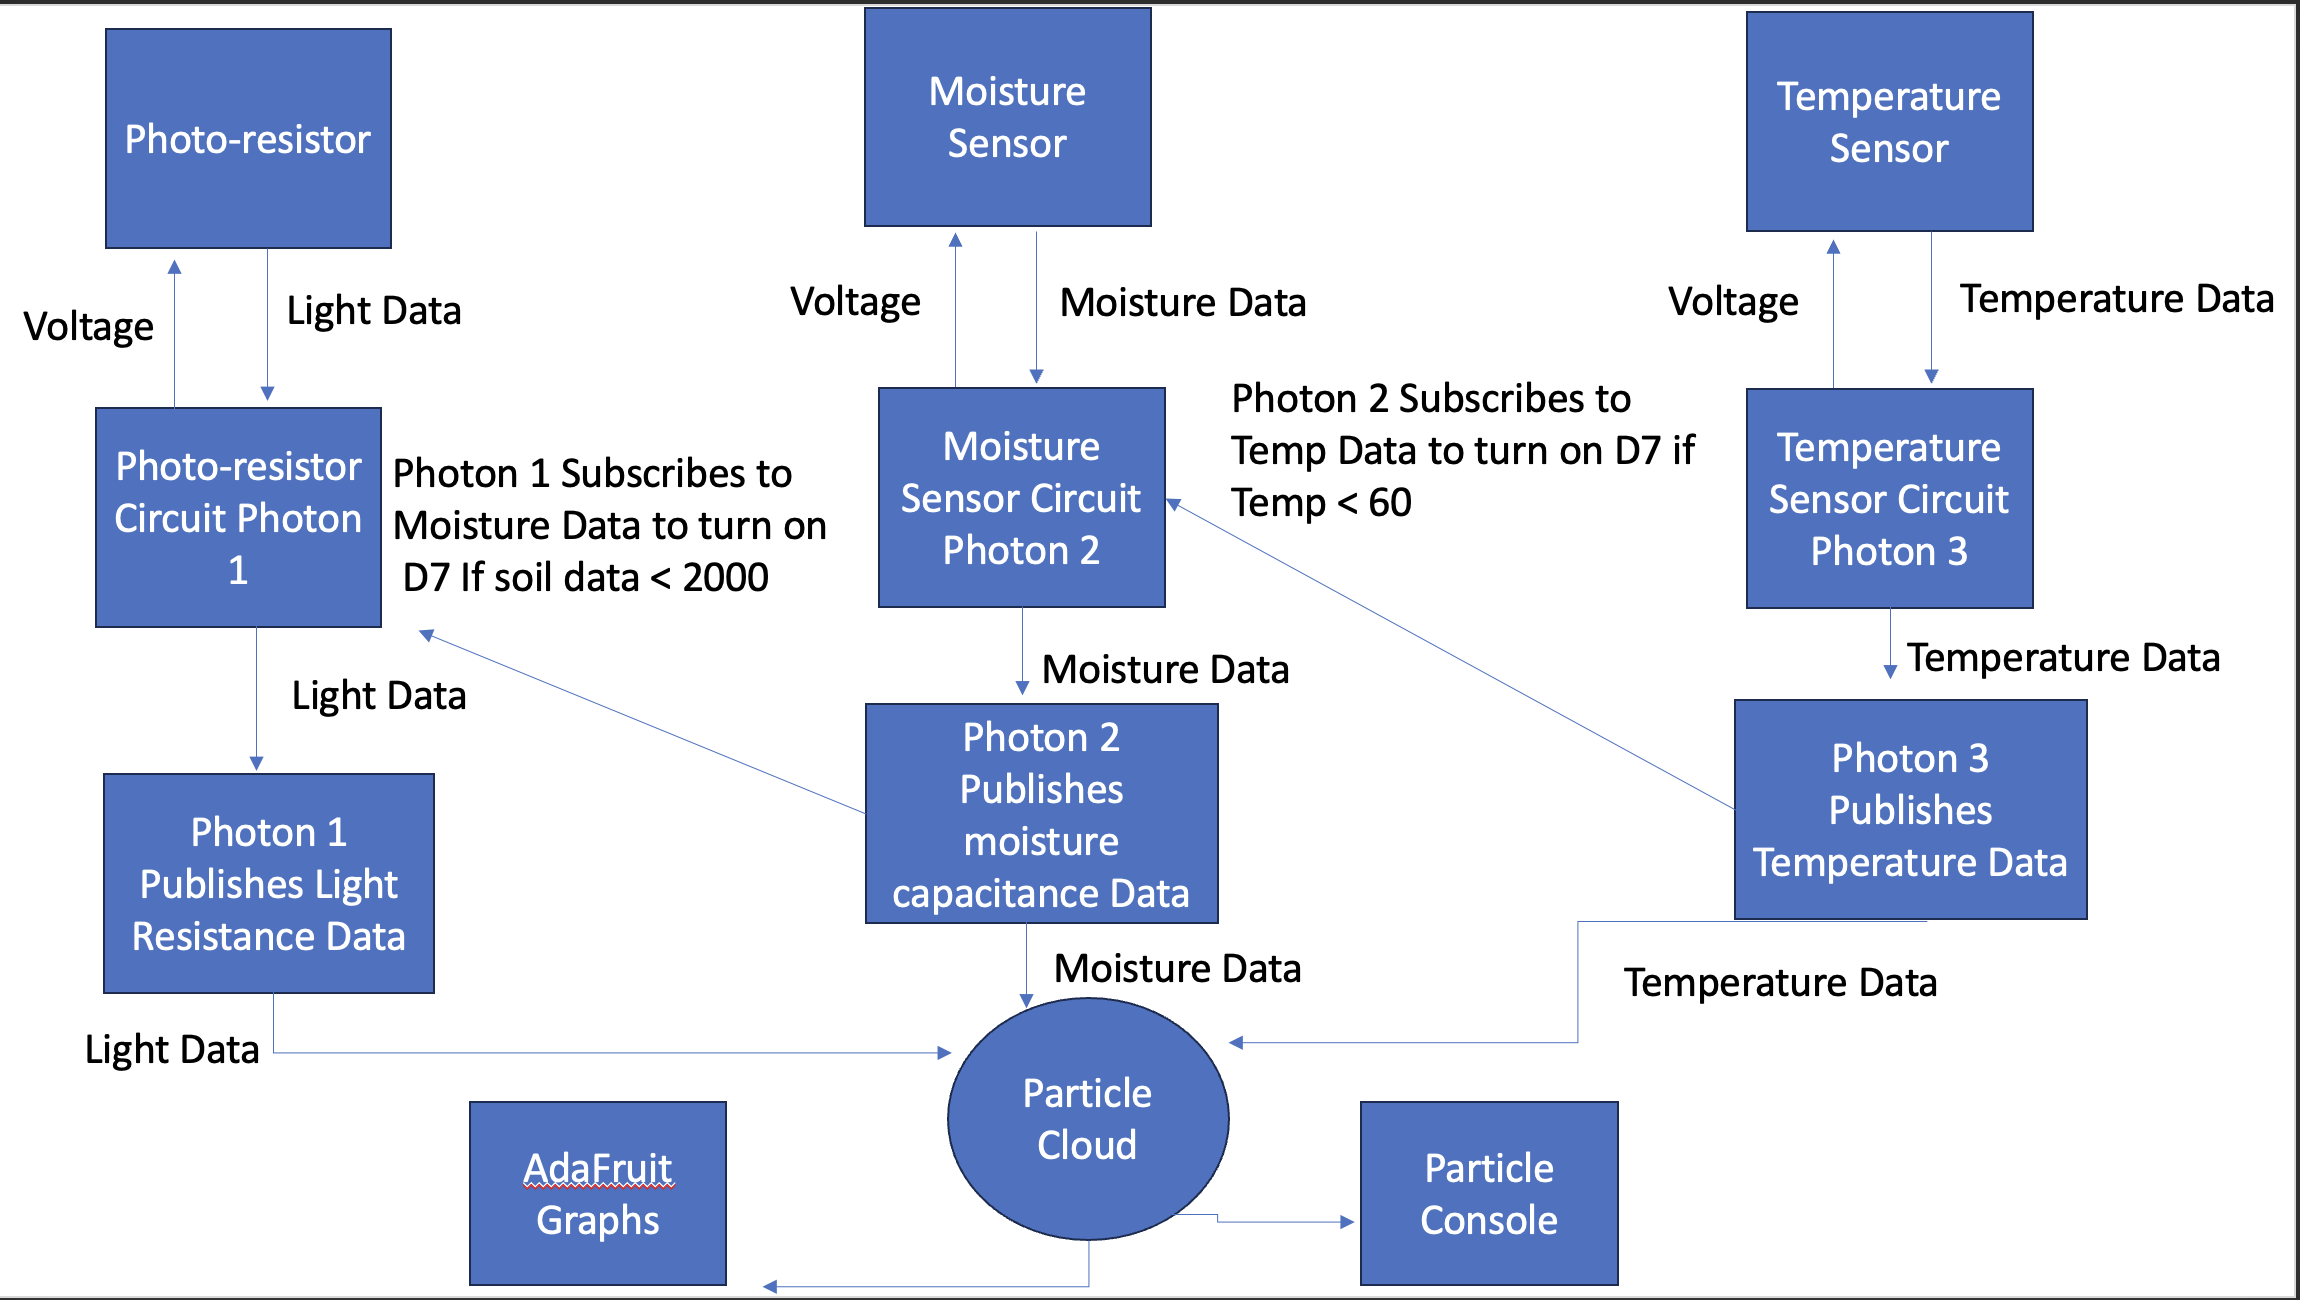
Do you love your plants? Well, they will love you back (maybe) if you keep them in a healthy environment. For plants to thrive they need some pretty specific conditions. The most important of these conditions being the temperature, the moisture of the soil, and the amount of sunlight. The sensors in this project are used to monitor these three conditions. The photo-resistor is for the sunlight measurement using resistance values that vary based on the amount of light it receives, the temperature sensor uses a thermistor to measure temperature, and the soil moisture sensor measures capacitance to measure the moisture of the soil that the sensor is placed in.
UsefulnessThis project is useful for anyone who has a plant that would like to ensure it is receiving it's optimal sunlight, temperature, and moisture needs. The project allows you to find the optimal place for the plant via the sunlight sensor. The temperature of the environment can be adjusted via information obtained from the temperature sensor and the plant can be shown to need more or less watering via the soil moisture sensor. The Photons also will turn on an LED light when the moisture level is too high, or when the temperature becomes too cold. All of this together will lead to healthier plants. This project could also be scaled up for a large-scale farming operation and would be immensely useful.
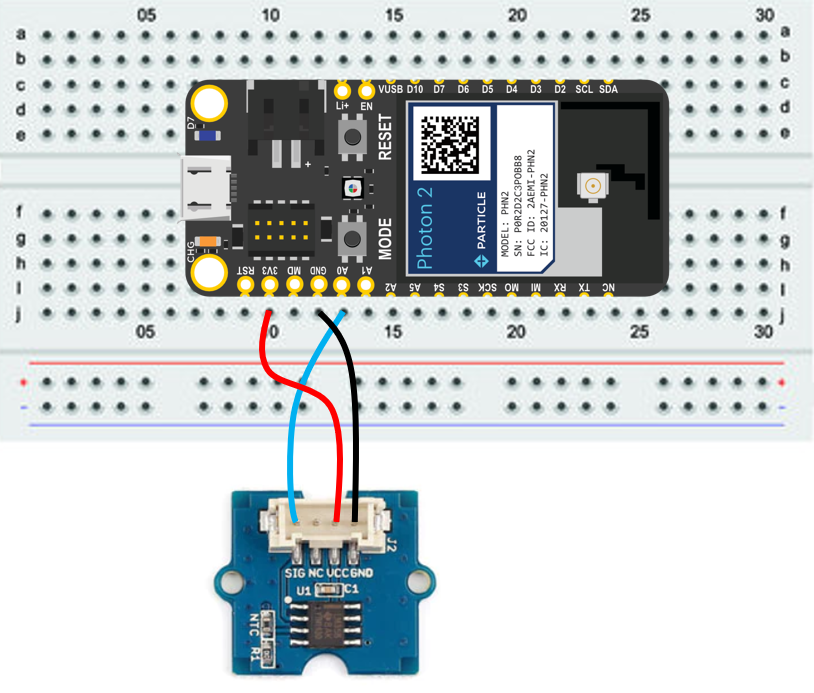
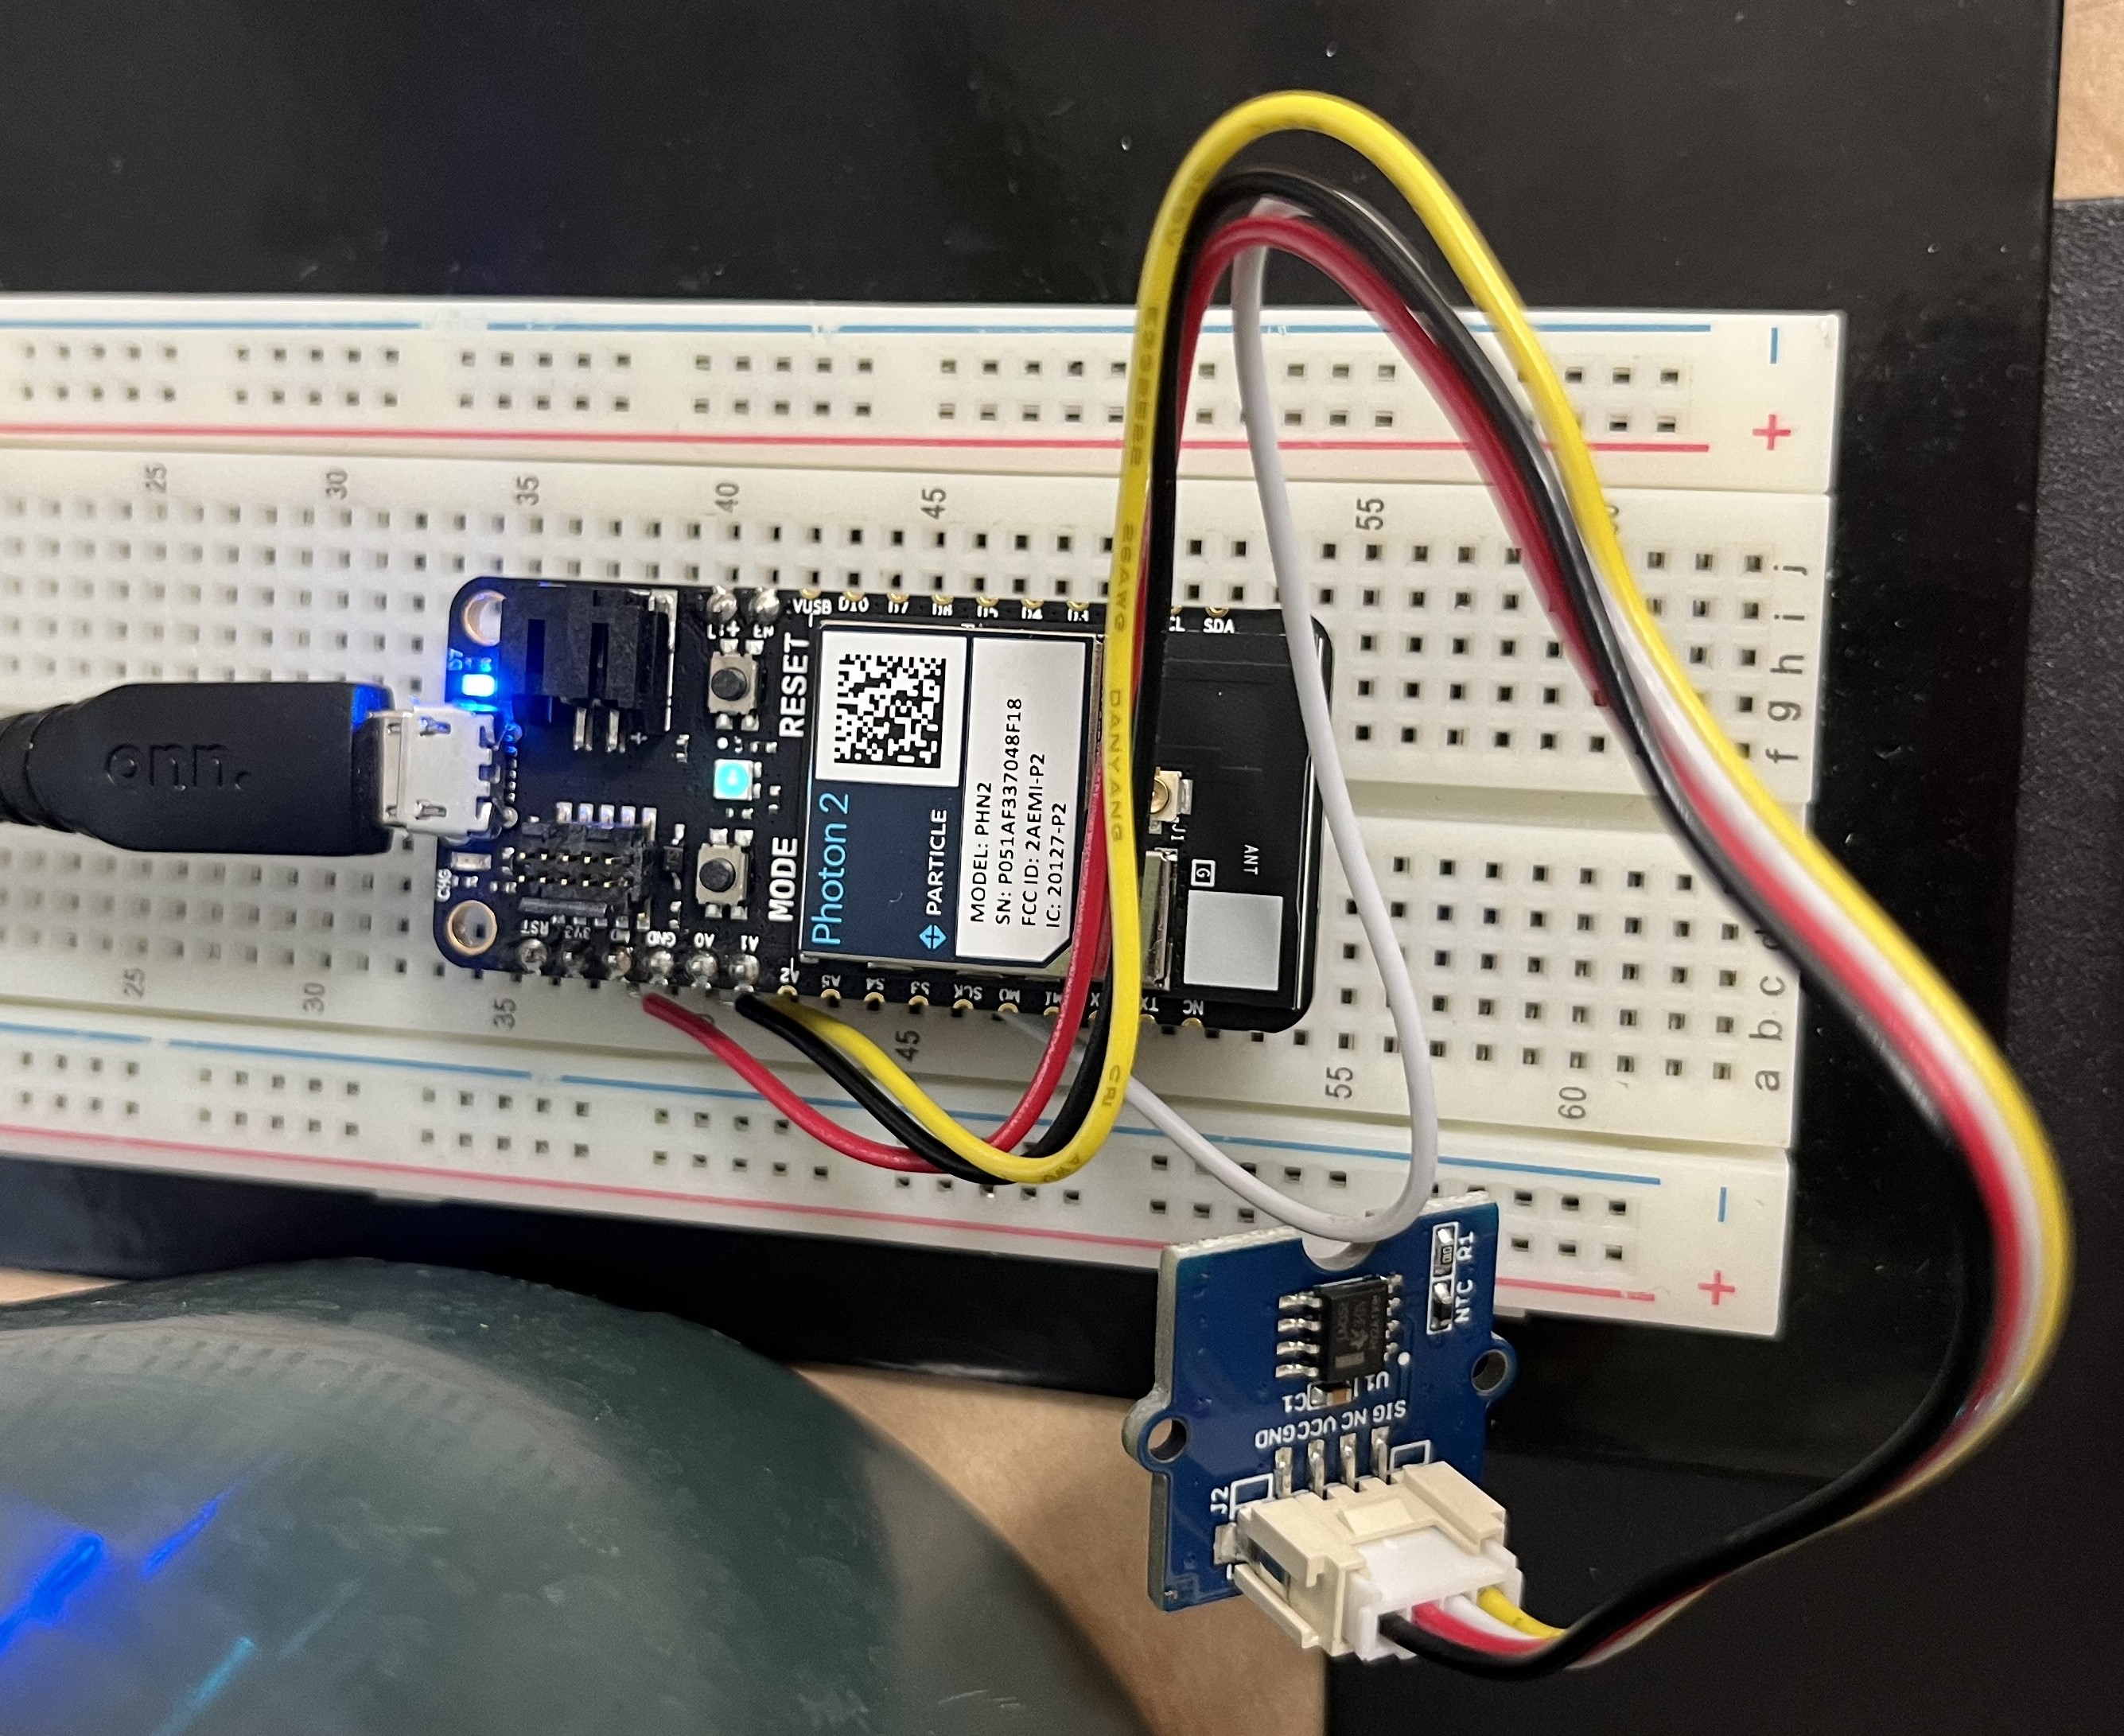
Sensor Information- TemperatureSensor: The temperature sensor uses a thermistor to detect the temperature of its surroundings. As the temperature decreases, the thermistors resistance will increase and vice versa.
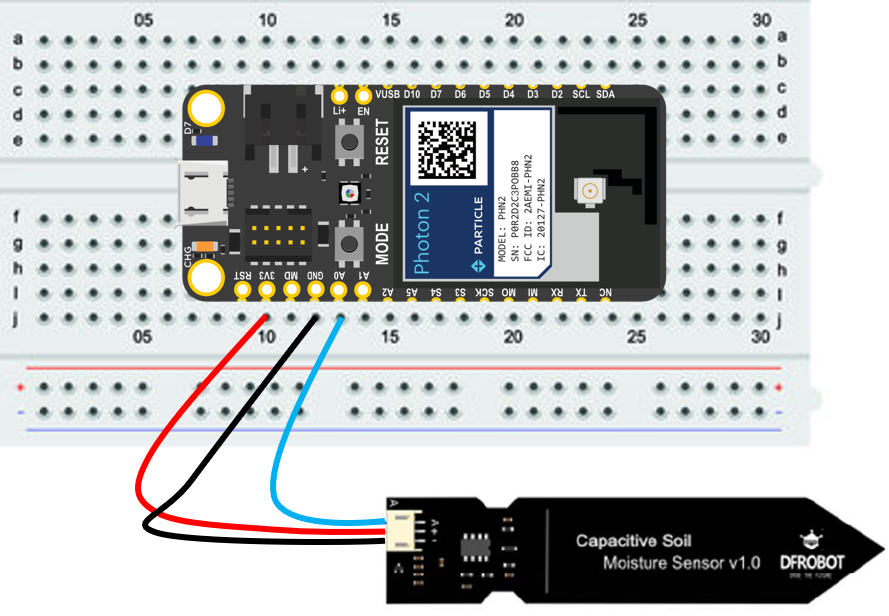
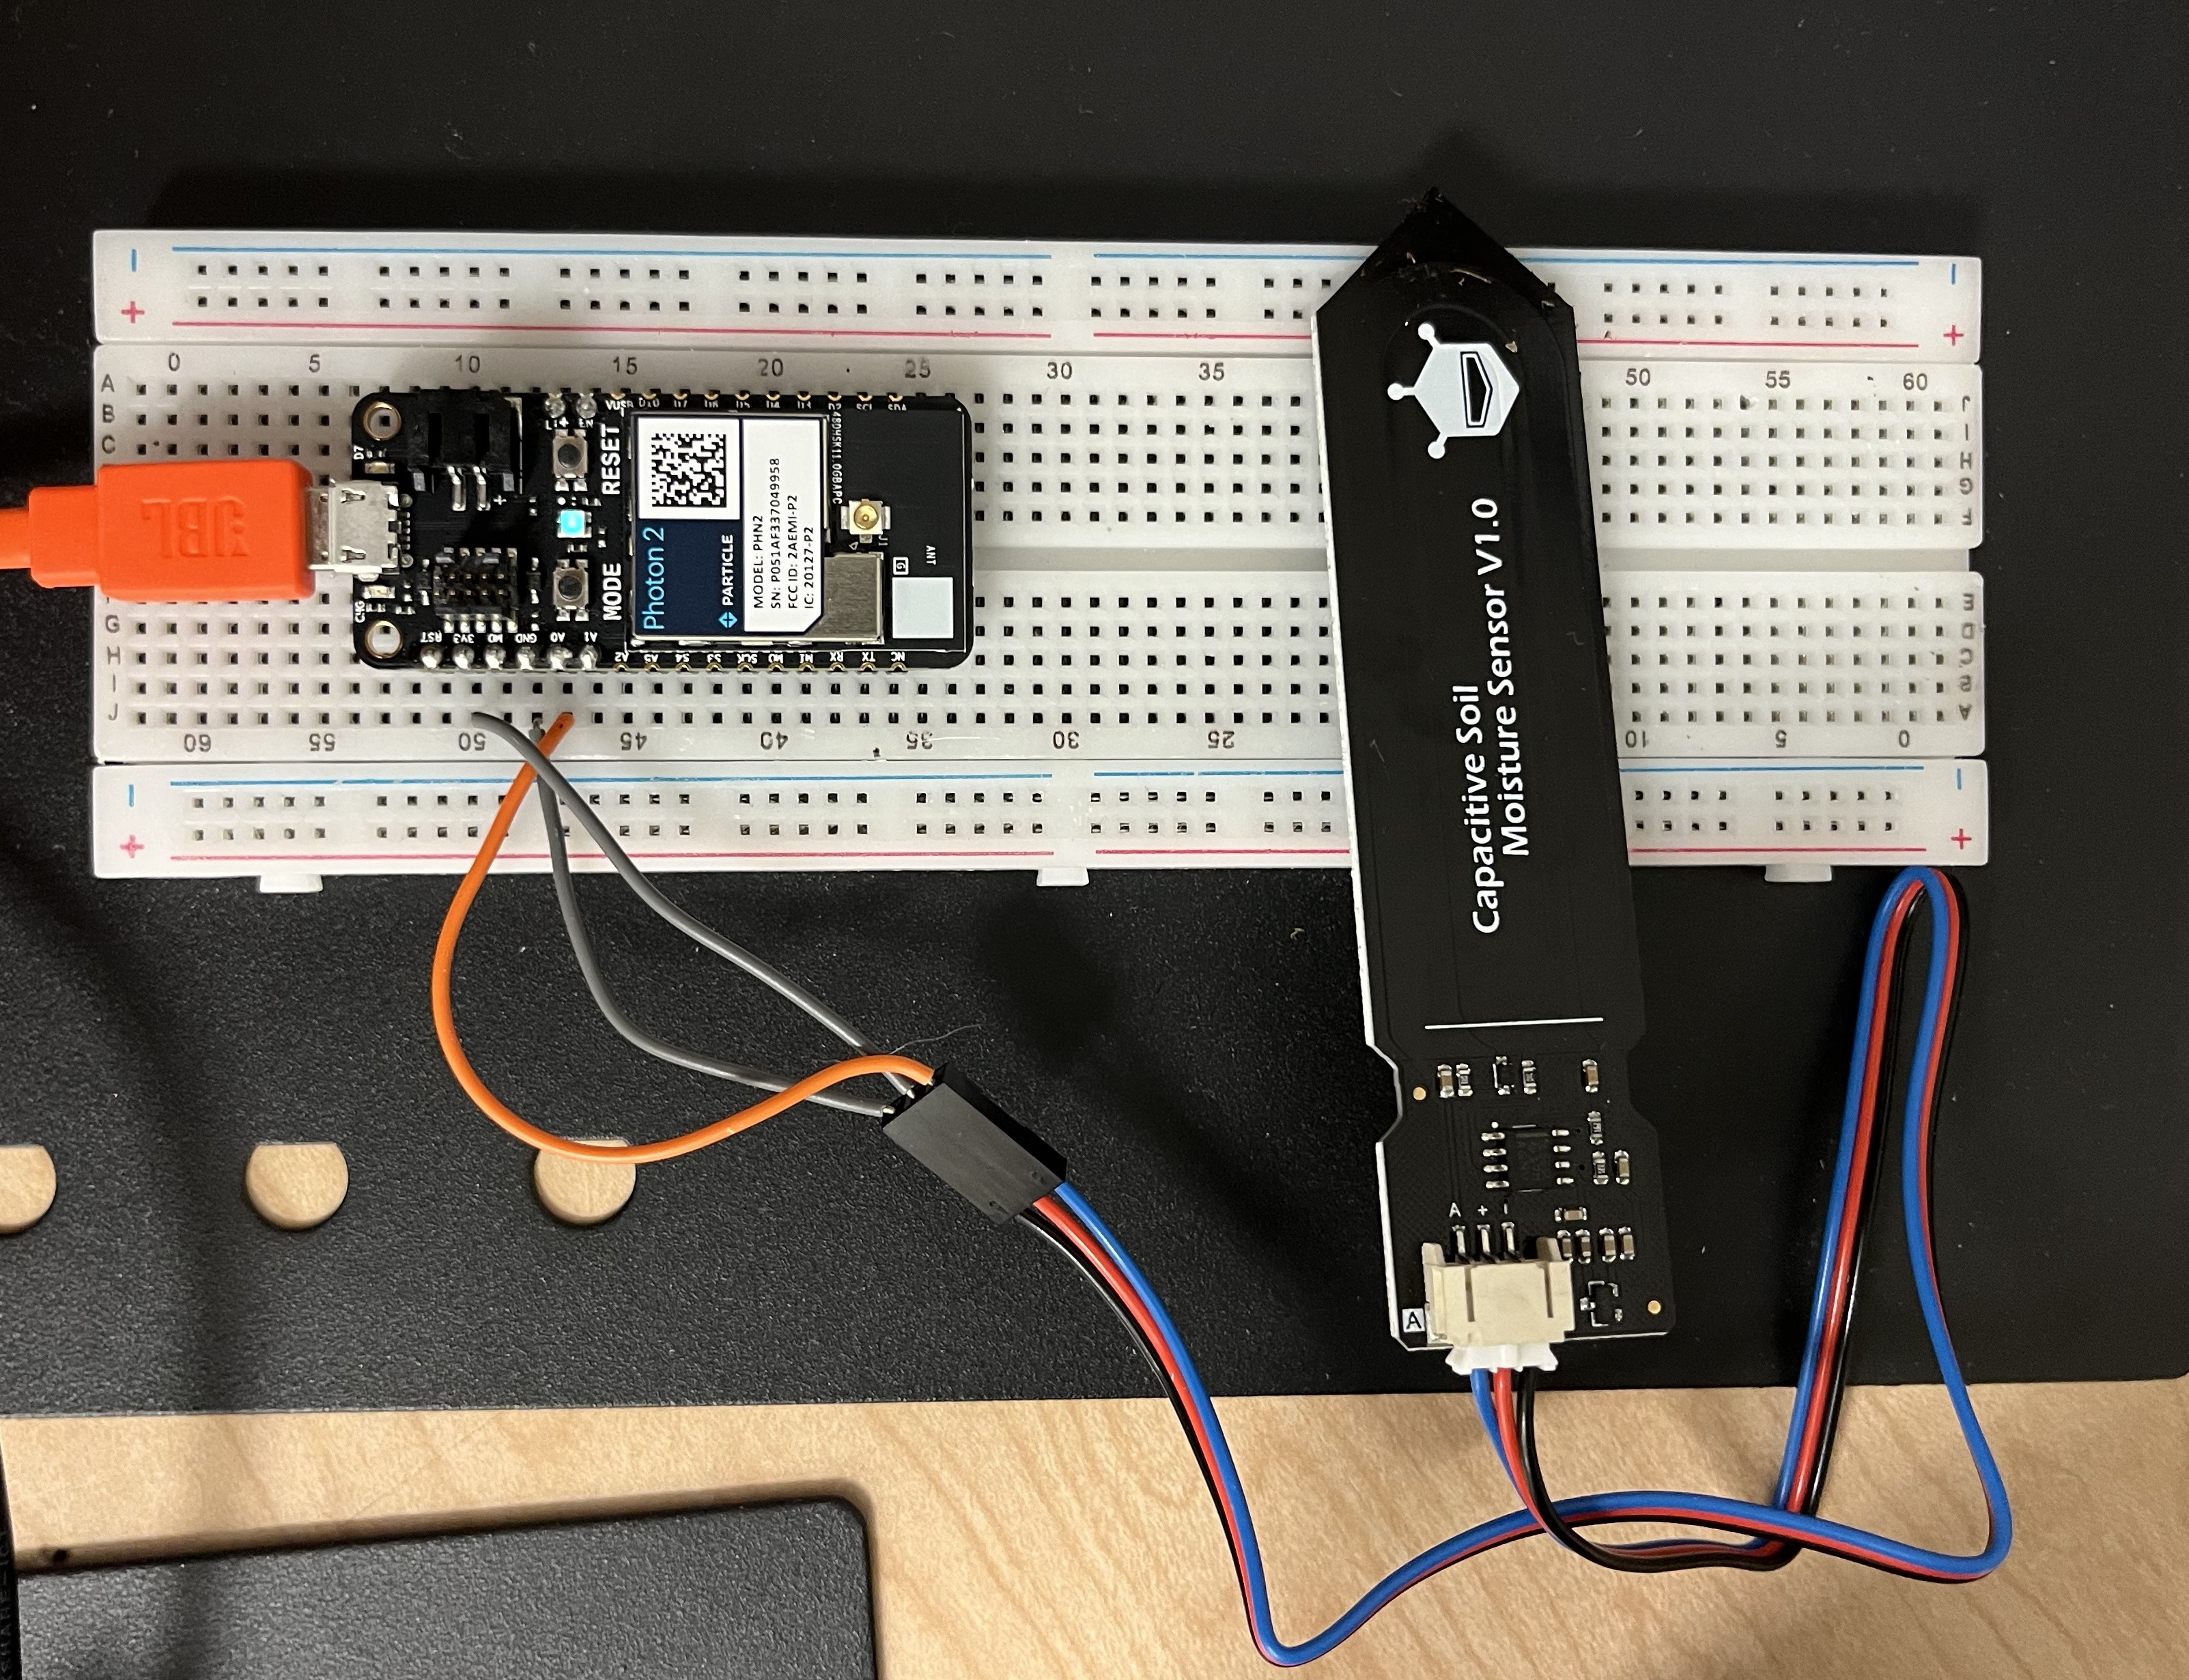
- SoilMoistureSensor: The capacitive soil moisture sensor measures the moisture of the soil by measuring the changes in the capacitance caused by the changes in the dielectric.
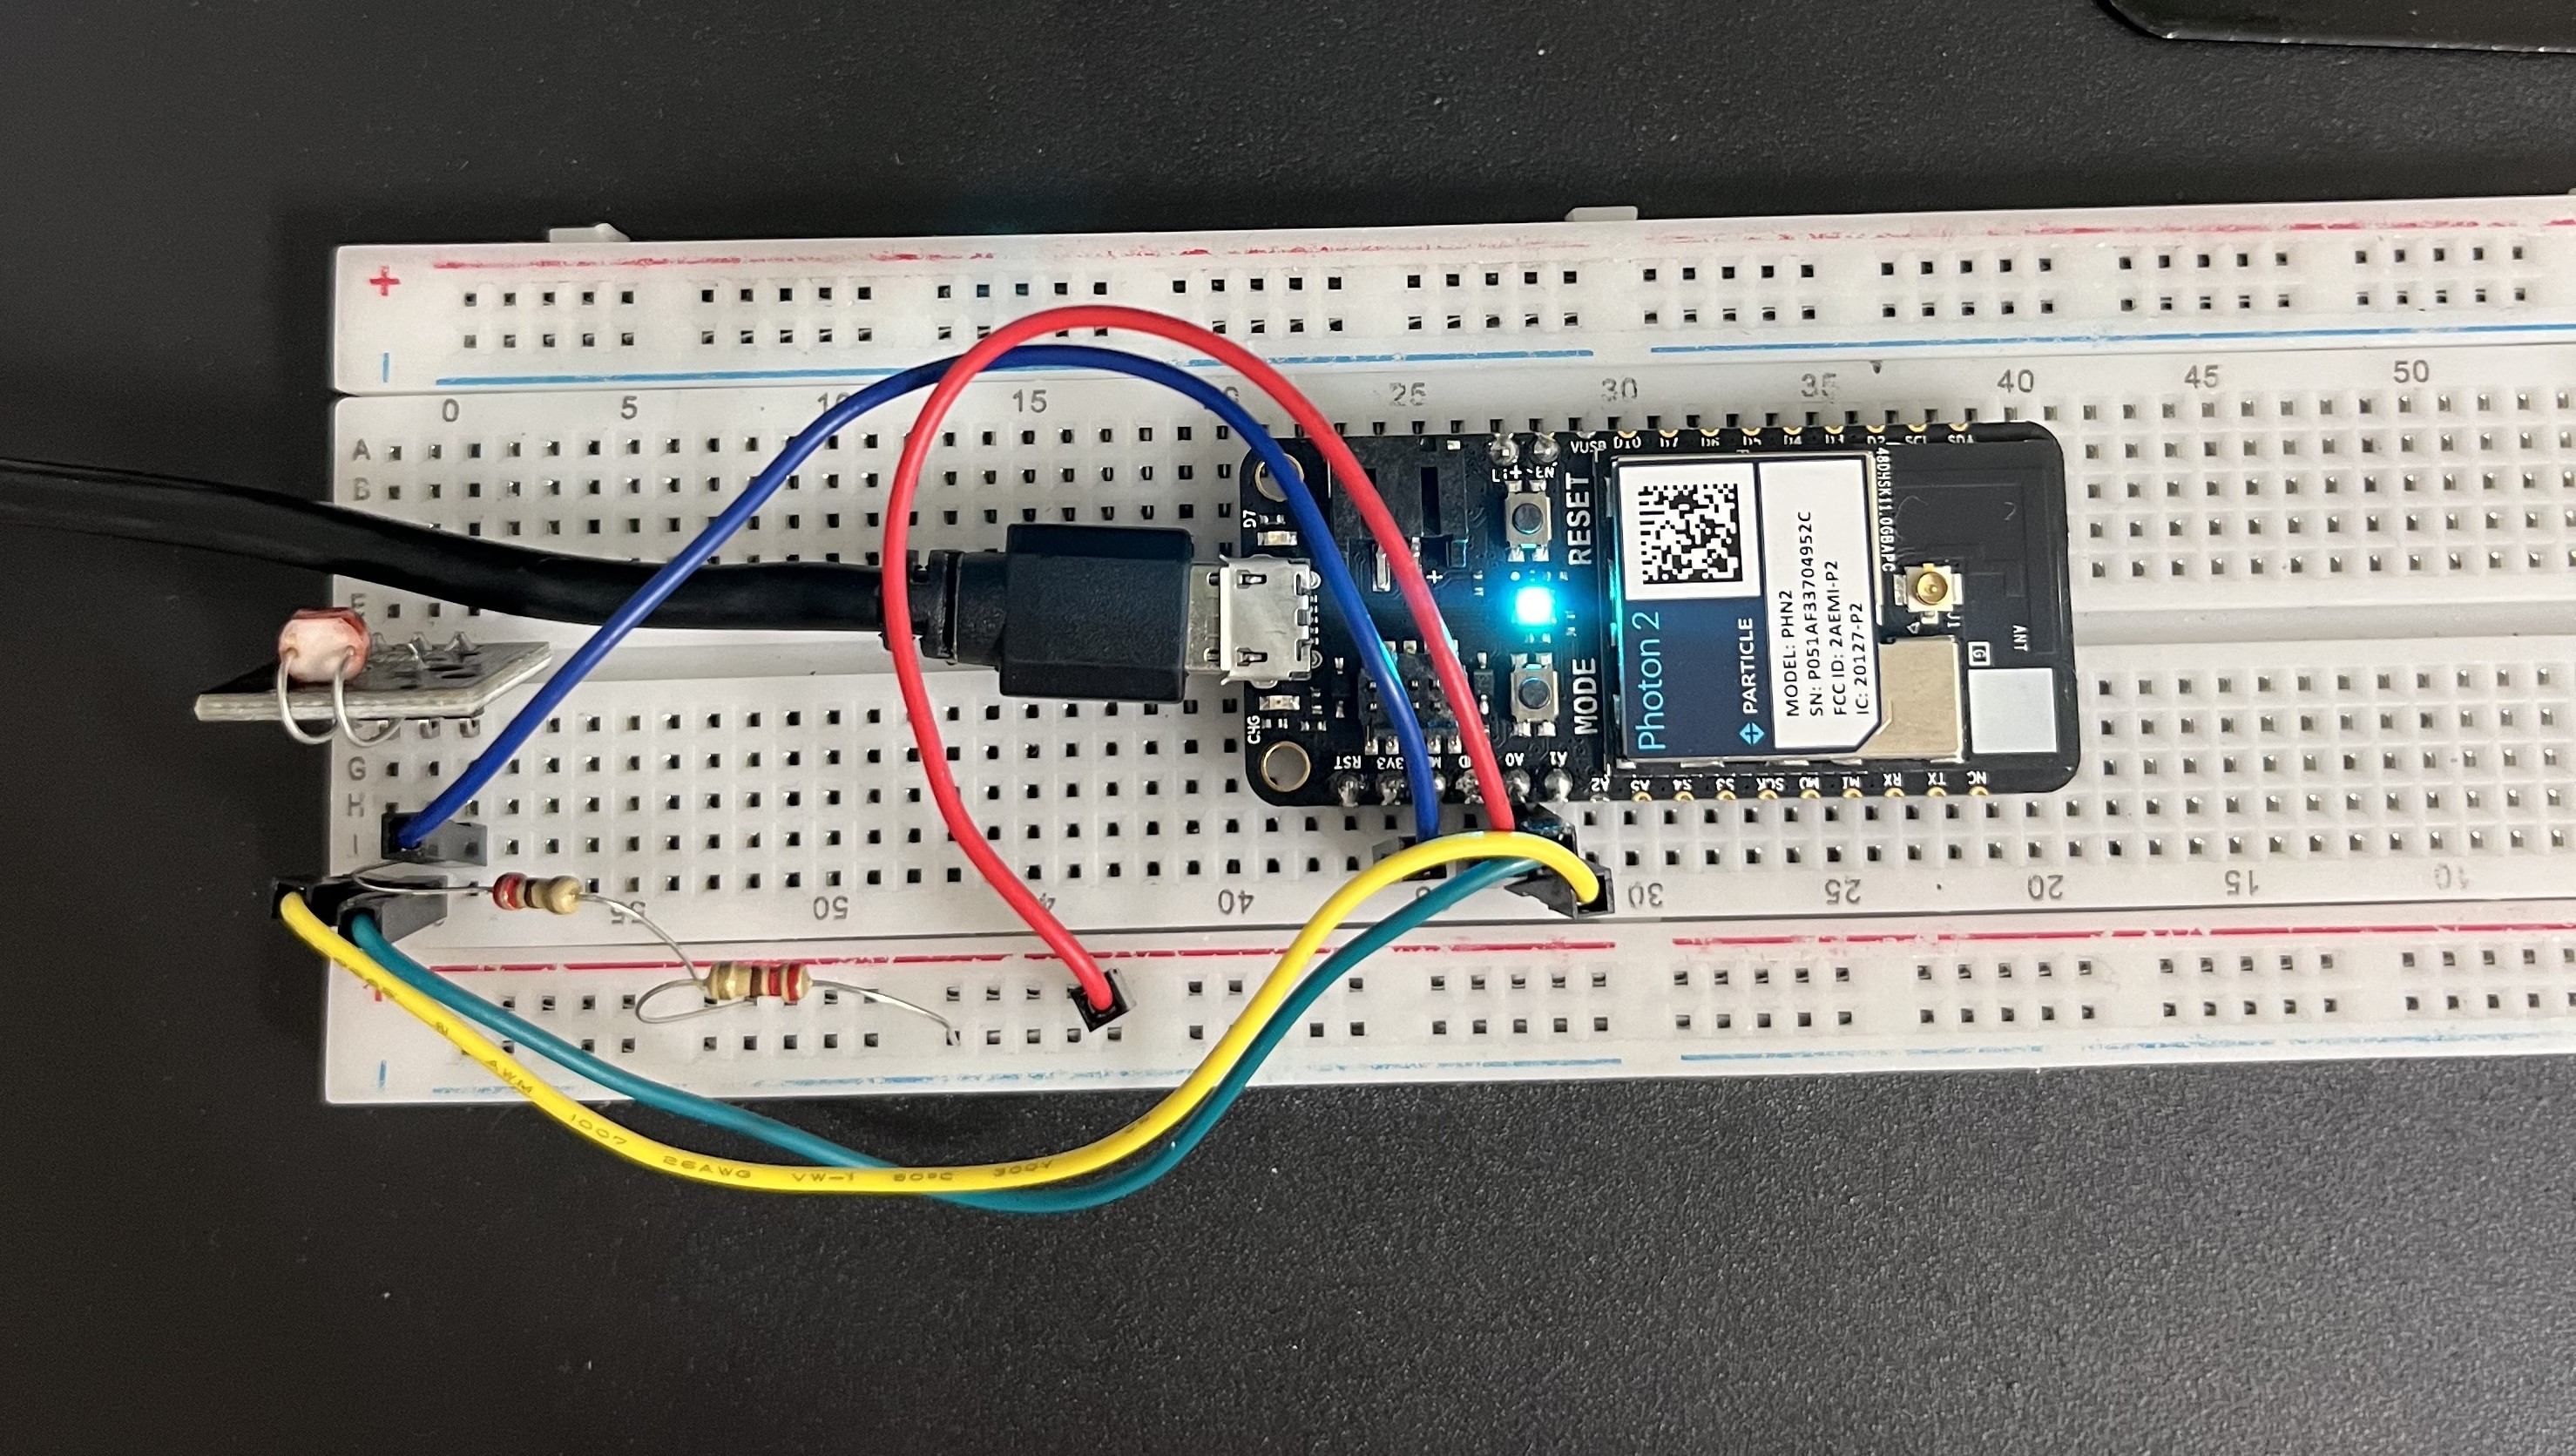
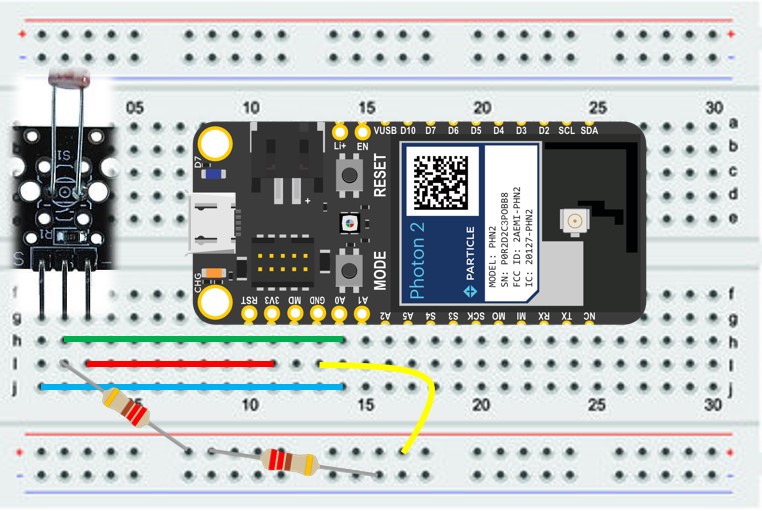
- Photo-resistorSensor: The Photo-resistor is used for the measurement of the amount of sunlight a plant would be exposed to. The photoresistor's resistance changes as it the light it is exposed to changes. This result is presented as a resistance value in ohms.
TemperatureGraph
The above Adafruit temperature graph is from the filming of our youtube video so the dips in the graph are from putting the temperature sensor next to the ice to prove both the Adafruit web-hook and the sensor work. The live link to the graph is provided below and the above graph can be observed by setting the filter to 11/29 6:35pm to 6:45pm.
https://io.adafruit.com/Nfurr7/feeds/temperature
SoilMoistureGraph
The above Adafruit soil moisture graph is from the filming of our youtube video so the dips in the graph are from putting the soil moisture sensor in water to prove both the Adafruit web-hook and the sensor work. The live link to the graph is provided below and the above graph can be observed by setting the filter to 11/29 6:00pm to 6:45pm.
https://io.adafruit.com/Nfurr7/feeds/soil-moisture
Photo-ResistorGraph
The photo-resistor graph is shown below as a screenshot from Adafruit. The photo-resistor was put on a balcony outside from 3pm until around 5:30pm. The graph shows the highest sunlight as being when the sensor was first placed and decreasing as the afternoon went on until it encountered the dark. Obviously the ideal sunlight conditions are during the middle of the day and not in the late evening once it gets dark. The live link to the Adafruit data is also provided below the graph within the screenshot can be observed by setting the data filter from 11/27/23 at 3:00pm to 11/27/23 at 5:30pm.




Comments
Please log in or sign up to comment.