With the growing threat of climate change promising to bring flooding, extreme storms and death to all life on Earth (starvation from death of crops, more disease because of increasing warmer areas, the list goes on), it becomes important to know how we can stop such bad changes from occurring. The first step to any such strategy to tackle climate change would be to carry out measurements of current pollution levels and then see what to do from there. I mean, you wouldn’t prepare for an exam without knowing the syllabus first.
In a similar vein, we need to know our enemy before we make plans to stop them. In the case of climate change, that knowledge would come from measurements of how bad the pollution in an area actually is.
Key indicators of this pollution are:
1) Carbon dioxide and VOC gases: CO2 literally causes the Earth to boil itself to death, in a process called the enhanced greenhouse effect, whereby heat energy from the Sun reaching the Earth is reflected by the ground, absorbed by CO2 molecules, which then radiate the heat energy back to the Earth’s surface, warming the Earth up.
CO2 pollution is what primarily causes the high temperatures which can lead to flooding of entire countries, as well as extreme changes in weather which will most definitely kill crops, leading to mass famine and starvation-induced death.
VOC pollution creates poisonous ozone gas from relatively harmless chemicals found in fertiliser and fuels. This type of pollution can cause lung failure and other respiratory diseases.
The MicroENV monitor can quantify the amount and concentration of CO2 and VOCs common enough to be environmentally damaging, like alcohols.
2) Particulate matter: Particulates are tiny ‘particles’ of solid matter, like sand, gravel and clay. They can cover the surface of plant leaves, thus preventing photosynthesis and affecting food production for humans and animals alike.
A high concentration of particulates can also mean the presence of illegal sand mining projects in an area, which contribute to destroying the landscape and reducing the biodiversity of forest ecosystems in the mined area.
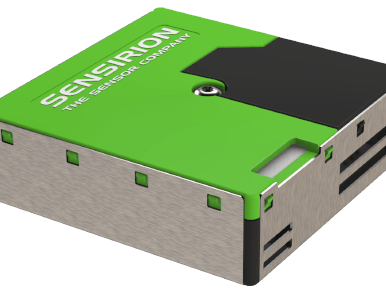
The SPS30 sensor in the MicroENV monitor can quantify the size and concentration of the most prevalent and dangerous particulate matter (PM2.5) and report this data over BLE for the user to determine the source of such particulate matter pollution.
3) Humidity and pressure: The humidity of a microclimate is a reliable indicator of storms like hurricanes and impending flash floods in the area. This is because a high humidity in an area means that rain clouds could form at any time because of the high concentration of water vapour in the atmosphere, and low humidity promotes the development of water-based wind storms like cyclones and hurricanes.
Pressure determines whether an area will receive rain or not, and if so, in how much volume. The reason behind this is fairly complex, but it basically boils down to the fact that ahigh pressure prevents water vapour near the ground from rising high into the sky to create rain clouds which could spread over an area.
Humidity is increased by increasing temperature, which is caused by dangerously high concentrations of CO2 and VOC gases in the atmosphere.
All the above quantities’ values can be measured and captured for use by the MicroENV’s operator, and as a valuable tool for environmental scientists to :
- Gauge how severely damaged and polluted the environment of an area is.
- Create highly accurate measurements of pollution in an area to advise local environmental protection agencies to improve plans to reduce the spread of pollution
- Obtained in a generic file format to be shared conveniently, easily and quickly with environmental agencies and people.
Note: this project submission is for Challenge 4 : Open Science
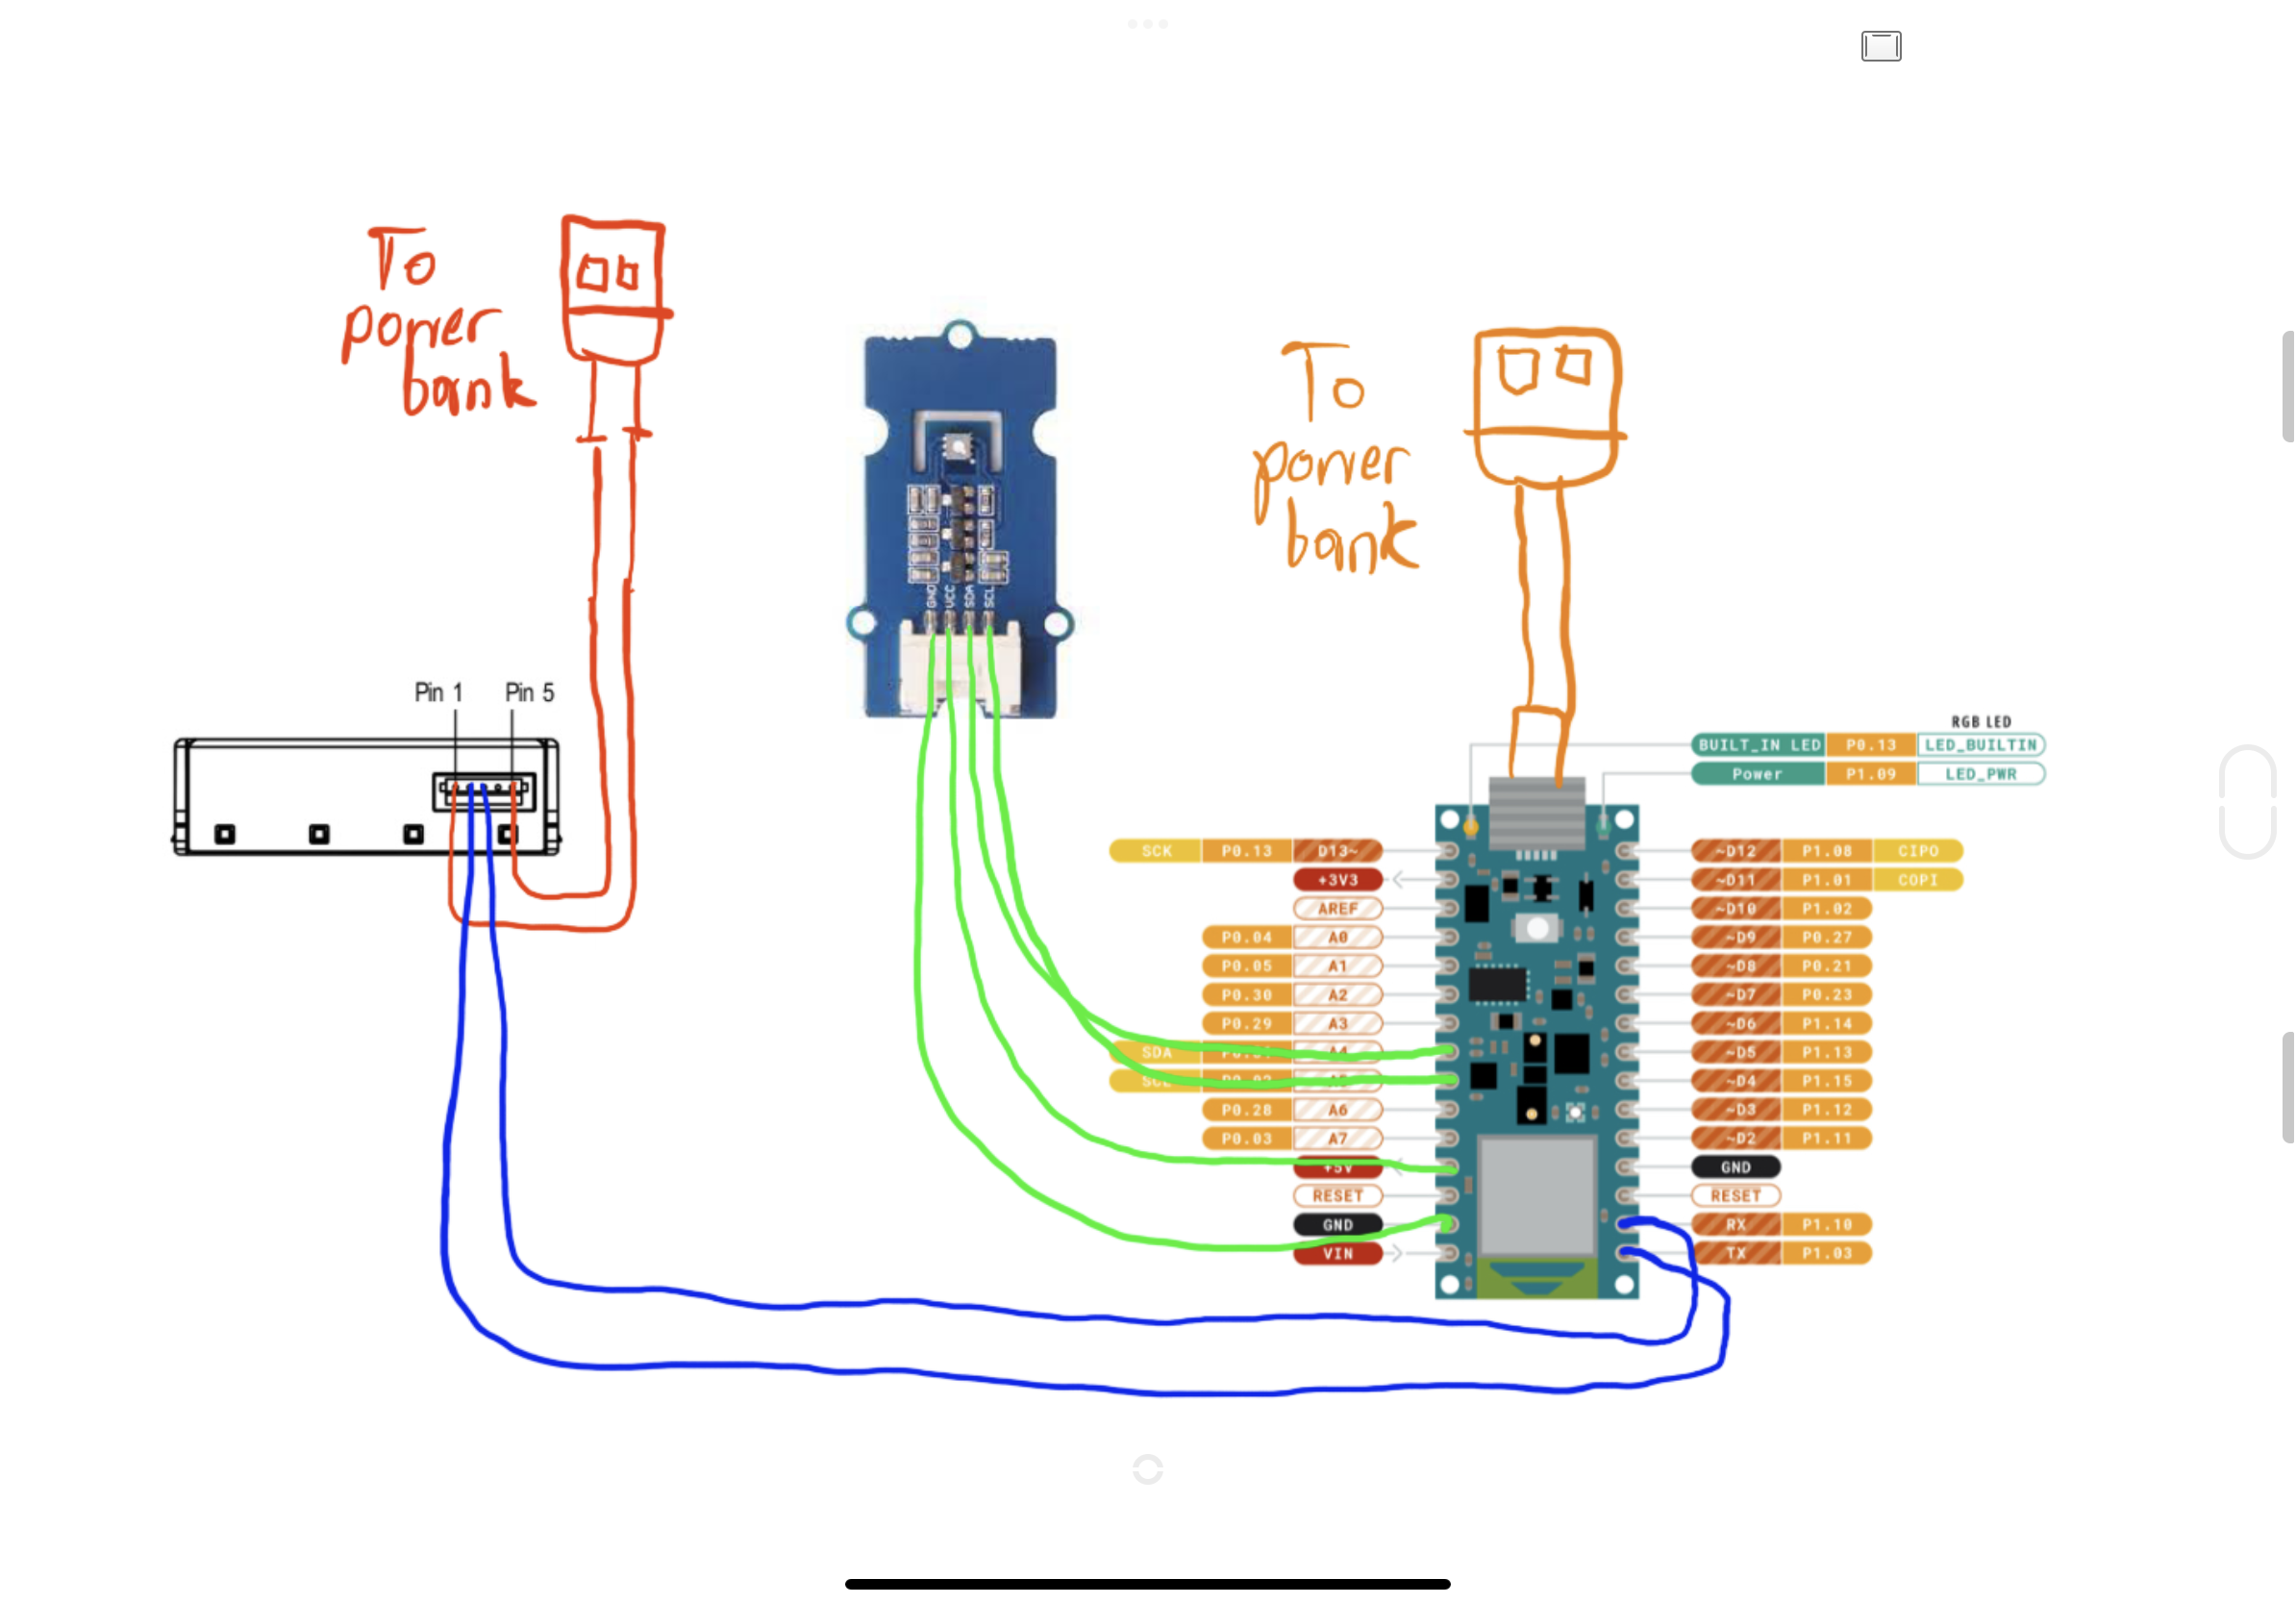
Hardware setup:Cut off the micro USB – B end of one USB cable as well as removing some of the USB cable’s shielding (grey splinter like mesh around the outside of the wires)
Straighten the exposed metal ends of the wires of the USB cable into a needle-like shape
Clean the metal ends
Solder the VDD pin of the SPS30 to the VCC pin of the wire in the USB cable (usually the red wire)
Solder the VDD pin of the SPS30 to the VCC pin of the wire in the USB cable (usually the black wire)
Plug the newly soldered USB-A end of the
Wiring:
RX - TX1 on the Nano 33 BLE Sense
TX- RX1 of the Sense
Interface selection - NC
Connect the Seeed SGP30 as follows:
VCC pin of SGP30 --> +5V pin of Nano
GND pin of SGP30 --> GND pin of Nano
SCL pin of SGP30 -->A5 pin of Nano
SDA pin of SGP30 --> A4 pin of Nano
Connect an uncut USB cable from the Nano’s USB port to your computer’s USB port to program it, and then to the Seeed power bank in order to power it in a portable manner.
And… the wiring is all set.
Note that this design is an ultra-versatile one, which means that there is no ‘fixed’ enclosure for the MicroENV, in other words, the housing of the MicroENV has to be designed by the operator, depending on which materials are available to them. That way, everyone can benefit from the user-defined form factor 😊.
Software SetupDownload the UART library for the SPS30 from this link:
https://github.com/paulvha/sps30
Click on the green Code button and then download as ZIP file
Then, extract the folder's contents and modify the .h file in the src folder, by doing this:
Edit the "#define INCLUDE_SOFTWARE_SERIAL 1" line in the sps30.h file to "#define INCLUDE_SOFTWARE_SERIAL 0" because SoftwareSerial isn't supported on the Nano 33 BLE.
Now, Upload the MicroENV code to Nano 33 BLE Sense via the uncut USB cable. Then, press Reset button on Nano 33 BLE, ensuring that the wiring has been constructed correctly. Once the blue LED on the Nano 33 BLE lights up, go to the nRF scanner app and connect to the client named "MicroENV" to collect measurement data.
Note: You can also use an Arduino Uno, Mega, or other AVR board that has a regulated 5V pin for power instead of a power bank, and plug the SPS30 into that. Both options are good. I am not liable for any hardware damage occurring while performing this project. Every sensor has a particular amperage and using a power source of the wrong supply voltage and/or current is not recommended.
Bill of materialsNano 33 BLE Sense : 20 USD
SPS30: 40 USD
Seeed SGP30: 12 USD
Seeed power bank : 15 USD
Wires : 1 - 2 USD
Total cost of materials : 88 USD
Many will be looking at this and say that it’s too pricey to build such a project. However, do consider the fact that almost all these sensors and the Arduino cost far less when bought in bulk, and the MicroENV suddenly seems extremely economic when industrially manufactured.
Add to that the durability of the hardware components in a dirty and rough environment along with their precision accuracy , and you have a long-lasting, highly accurate environmental monitor.


Comments
Please log in or sign up to comment.