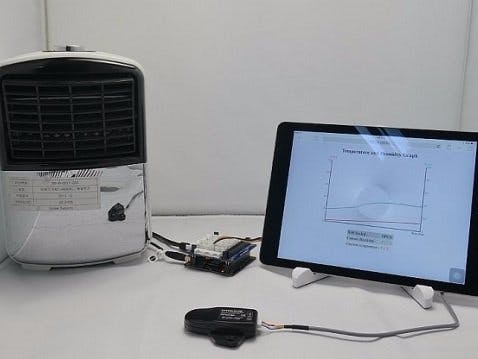
<?php
$ws_host = _SERVER("HTTP_HOST");

set_time_limit(30);

?>
<!DOCTYPE html>
<html>
<head>
<title>PHPoC / <?echo system("uname -i")?></title>
<meta content="initial-scale=0.5, maximum-scale=1.0, minimum-scale=0.5, width=device-width" name="viewport">
<style type="text/css">
body {font-family : "calibri"}
</style>
<script type="text/javascript">
var ws;
var canvas;
var ctx;
var WIDTH = 655;
var HEIGHT = 460;
var graphWIDTH = 590;
var graphHEIGHT = 400;
var padding = 30;
var hmids =  Array.apply(null, new Array(60)).map(Number.prototype.valueOf,0);  //init array hmids to 0
var temps =  Array.apply(null, new Array(60)).map(Number.prototype.valueOf,0);  //init array temps to 0

function addlabels(){
ctx.font = "18px calibri";

/* y axis labels for temp */
ctx.fillStyle = "#DF4D55";
ctx.fillText("T ('C)", 15, 15);
ctx.fillText(" 50", 0, 35);
ctx.fillText(" 40", 0, 115);
ctx.fillText(" 30", 0, 195);
ctx.fillText(" 20", 0, 275);
ctx.fillText(" 10", 0, 355);
ctx.fillText(" 0",  10, 435);

/* y axis labels for hmid */
ctx.fillStyle = "#20B2AA";
ctx.fillText("H (%)", graphWIDTH+15, 15);
ctx.fillText(" 100", graphWIDTH+28, 35);
ctx.fillText(" 80", graphWIDTH+33, 115);
ctx.fillText(" 60", graphWIDTH+33, 195);
ctx.fillText(" 40", graphWIDTH+33, 275);
ctx.fillText(" 20", graphWIDTH+33, 355);
ctx.fillText(" 0",  graphWIDTH+33, 435);

/* x axis labels */
ctx.fillStyle = "#383838";
ctx.fillText("Time (Sec.)", 570, 450);
}

function drawguide()
{
    ctx.lineWidth = 0.5;
    ctx.strokeStyle = "#C3C3C3";
    ctx.beginPath();

    //10'c
    ctx.moveTo(padding, 350);
    ctx.lineTo(graphWIDTH + padding, 350);
    ctx.stroke();
    //20'c
    ctx.moveTo(padding, 270);
    ctx.lineTo(graphWIDTH + padding, 270);
    ctx.stroke();
    //30'c
    ctx.moveTo(padding, 190);
    ctx.lineTo(graphWIDTH + padding, 190);
    ctx.stroke();
    //40'c
    ctx.moveTo(padding, 110);
    ctx.lineTo(graphWIDTH + padding, 110);
    ctx.stroke();

}

function drawXY()
{
    ctx.lineWidth =  4;
    ctx.strokeStyle = "#828282";
    ctx.beginPath();
    /* y axis for temp along the left edge of the canvas*/
    ctx.moveTo(padding,padding);
    ctx.lineTo(padding,graphHEIGHT + padding+2);
    ctx.stroke();
    /* x axis along the bottom edge of the canvas*/
    ctx.moveTo(padding, graphHEIGHT + padding);
    ctx.lineTo(graphWIDTH + padding,graphHEIGHT + padding);
    ctx.stroke();
    /* y axis for hmid along the bottom edge of the canvas*/
    ctx.moveTo(graphWIDTH + padding,graphHEIGHT + padding + 2);
    ctx.lineTo(graphWIDTH + padding,padding);
    ctx.stroke();

}

function plotdata_hmid()
{
    ctx.lineWidth = 3;
    ctx.strokeStyle = "#20B2AA";
    ctx.shadowBlur = 2;
    ctx.shadowColor = 'rgb(255, 255, 255)';
    ctx.beginPath();

    for (var j in hmids)
    {
        val = HEIGHT-(hmids[j] * 4);
        ctx.lineTo((j*10) + padding, (graphHEIGHT + padding) - (hmids[j]) * 4);
        ctx.stroke();
    }
}
function plotdata_temp()
{
    ctx.lineWidth = 3;
    ctx.strokeStyle = "#DF4D55";
    ctx.shadowBlur = 2;
    ctx.shadowColor = 'rgb(255, 255, 255)';
    ctx.beginPath();

    for (var j in temps)
    {
        val = HEIGHT-(temps[j] * 8);
        ctx.lineTo((j*10) + padding, (graphHEIGHT + padding) - (temps[j]) * 8);
        ctx.stroke();
    }
}

function clear() {
    ctx.clearRect(0, 0, WIDTH, HEIGHT);
}

function draw() {
    clear();
    drawguide();
    plotdata_hmid();
    plotdata_temp();
    drawXY();
    addlabels();
}

function ws_init()
{
    ws = new WebSocket("ws://<?echo _SERVER("HTTP_HOST")?>/htx23c", "text.phpoc");
    document.getElementById("ws_state").innerHTML = "CONNECTING";

    ws.onopen  = function(){ document.getElementById("ws_state").innerHTML = "OPEN" };
    ws.onclose = function(){ document.getElementById("ws_state").innerHTML = "CLOSED"};
    ws.onerror = function(){ alert("websocket error " + this.url) };

    ws.onmessage = ws_onmessage;
}

function hmid_array(hmid)
{
    var last_pos;
    last_pos = 59;

    for (var i =  0; i < last_pos; i ++ )
        hmids[i] = hmids[i+1];

    hmids[last_pos] = hmid;
}

function temp_array(temp)
{
    var last_pos;
    last_pos = 59;

    for (var i =  0; i < last_pos; i ++ )
        temps[i] = temps[i+1];

    temps[last_pos] = temp;
}

function ws_onmessage(e_msg)
{
    e_msg = e_msg || window.event;
      var rdata = e_msg.data;
      var array_rdata = rdata.split(",");

      hmid_array(array_rdata[0]);
      temp_array(array_rdata[1]);

    canvas = document.getElementById("canvas_graph");
    ctx = canvas.getContext("2d");
    draw();

    document.getElementById("ws_reply_hmid").innerHTML = array_rdata[0];
    document.getElementById("ws_reply_temp").innerHTML = array_rdata[1];
}
window.onload = ws_init;
</script>
</head>
<body bgcolor="#EEF0FF">
<center>
      <H1>Temperature and Humidity Graph</H1>
      <canvas id="canvas_graph" width="650" height="460"></canvas><br />
      <table cellpadding="2" cellspacing="2">
         <tr bgcolor="#CCCCCC">
         <td><font size="5">Web Socket : </font></td>
         <td><font size="5"><span id="ws_state"></span></font></td>
         </tr>
         <tr bgcolor="#DDDDDD">
         <td><font size="5">Current Humidity: </font></td>
         <td><font size="5" color="#20B2AA"><span id="ws_reply_hmid"></span> %</font></td>
         </tr>
         <tr bgcolor="#EEEEEE">
         <td><font size="5">Current temperature : </font></td>
         <td><font size="5" color="#DF4D55"><span id="ws_reply_temp"></span> 'C</font></td>
         </tr>
      </table>
</center>
</body>
</html>


Comments
Please log in or sign up to comment.