One thing that a lot of people need these days is a security system. Something to notify you when there is movement or activity near your proximity. So for our project, we decided to use two particle argons that would do just that by communicating together. One argon will detect motion using a motion sensor and the other argon will notify you by lighting up an LED.
How It Works
The first particle argon will be connected to a PIR motion sensor that was acquired through Newark. When this sensor detects motion, it will send an event to the Particle Cloud. The second Particle Argon is also connected to the cloud and it is also connected to a green LED. When the first argon publishes an event in the cloud, the second argon will be activated and it will light up the LED.
The first argon is connected to the PIR motion sensor. The argon supplies the voltage to the sensor through the 3V pin and the GND pin. The third wire from the motion sensor is connected to the D4 pin.
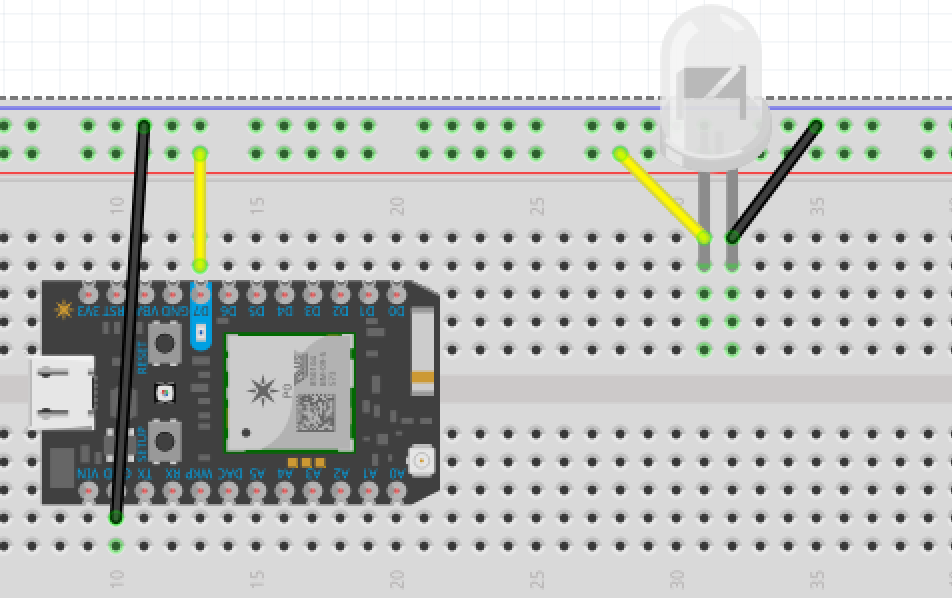
The second argon is connected to the LED light. The argon supplied voltage to the LED through pin D7 and the GND pin.
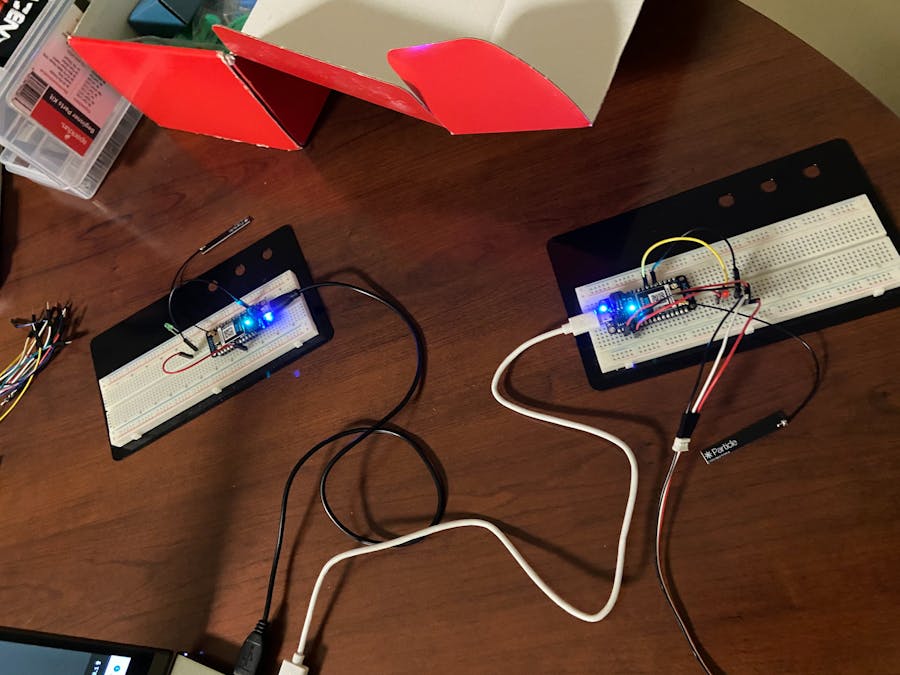
We used the Particle Build website to create the code for both Particle Argons. Once the codes were made, we then uploaded them onto the argons and flashed them with their respective code. This allows the first argon to publish events on the cloud whenever motion is detected, the second argon then receives the data and sends a signal to the LED to turn on. Below we have a couple of pictures and a video of our project along with a graph demonstrating some data collected through some of our trial and test runs.
LED and Motion Sensor Circuit
The images below represent the setup for the motion sensor and LED circuits. The motion sensor required a motion sensor, 10 jumper wires, and an argon as the power source. The LED setup consisted of 5 jumper wires and an argon to communicate with the other argon and to act as a power supply to the green LED also included.
1 / 2 • Figure 1: LED Circuit
Video Demonstration
Figure 3: Video Demonstration
Graph
The following is a graph plotted using data collected from one of our trials. Using the IFTTT Maker service, we were able to transfer data into an excel sheet. The graph represents the date and time the trial was run (x-axis) and the number of times it detected motion/motion sensor and LED argon were communicating(y-axis).


_zhWsCcSEcl.jpg?auto=compress%2Cformat&w=48&h=48&fit=fill&bg=ffffff)


Comments
Please log in or sign up to comment.