Paddy field is one of the major sources of greenhouse gases (both CH4 methane and NOx nitrogen oxides) according to some research, however, some recent research suggests that there are miscalculations.
https://www.asean-agrifood.org/thai-researchers-track-greenhouse-gases-from-rice-field/
Rajkishore, S. K. et al. “METHANE EMISSION FROM RICE ECOSYSTEMS: 100 YEARS OF RESEARCH.” (2015). https://www.semanticscholar.org/paper/METHANE-EMISSION-FROM-RICE-ECOSYSTEMS%3A-100-YEARS-OF-Rajkishore-Vignesh/d080f93f23bf8c23f398243b913a7c0a2cd3273c
To find out, I build an easily deployed CH4 monitor to help rice farmers or other interested citizen scientist to look into this issue. Because rice is the main source of food for most Asian countries, it is important that we acknowledge the problem accurately and respond accordingly. To make things simpler, I only worked on CH4 this time, but I hope that my work could inspire fellow makers to develop the NOx monitor as well. As NOx involves more than one substance and thus they are more difficult to measure.
My original plan was to create an off-grid system making use of solar power and LoRa transmission, but the AS923-2 frequency (which is the standard frequency where I live) is not stably supported by the gateway I bought and The Things Network. After several attempts, I had to give up and switch to WiFi and Blynk.
Before I start I would like to give credit to the many projects before me, they provided me with shortcuts and inspirations to work out this CH4 monitor project, and they are listed in the session below. Thank you all!
1. Wio Terminal
The Wio Terminal is a SAMD51-based microcontroller with Wireless Connectivity powered by Realtek RTL8720DN that’s compatible with Arduino and MicroPython. Currently, wireless connectivity is only supported by Arduino. It runs at 120MHz (Boost up to 200MHz), 4MB External Flash and 192KB RAM. It supports both Bluetooth and Wi-Fi providing backbone for IoT projects. The Wio Terminal itself is equipped with a 2.4” LCD Screen, onboard IMU(LIS3DHTR), Microphone, Buzzer, microSD card slot, Light sensor, and Infrared Emitter(IR 940nm). On top of that, it also has two multifunctional Grove ports for Grove Ecosystem and 40 Raspberry pi compatible pin GPIO for more add-ons.
https://wiki.seeedstudio.com/Wio-Terminal-Getting-Started
To set up the Arduino environment and upload code, please refer to the Seeed Studio official website.
2. MQ4 Methane Sensor
MQ4 is a cheap, easy-to-use sensor to detect the concentration of Methane. It is a good starting point, but there are also other options such as MQ214,
Here's the datasheet of MQ4: https://www.sparkfun.com/datasheets/Sensors/Biometric/MQ-4.pdf
The sensor runs on 5V and comes with both digital and analog outputs. In this project, I used analog reading to get the actual concentration rather than digital signal, because digital signal only shows whether CH4 is "present" judging by a user-determined threshold. Digital signal is useful for leakage detection but not for measurement.
3. SHT40 temperature and humidity sensor
The sensor comes with the Wio Terminal Development Kit, for more details please refer to the above Seeed Studio website. The development kit comes with other sensors too, here I only included the components that I used.
Tutorial, library and sample code can be found here: https://wiki.seeedstudio.com/Grove-Temp-Humi-Sensor-Grove-LoRa-E5/
This sensor can be plugged in directly into the bottom sockets of the Wio Terminal and adopts I2C protocol.
4. Solar Power System
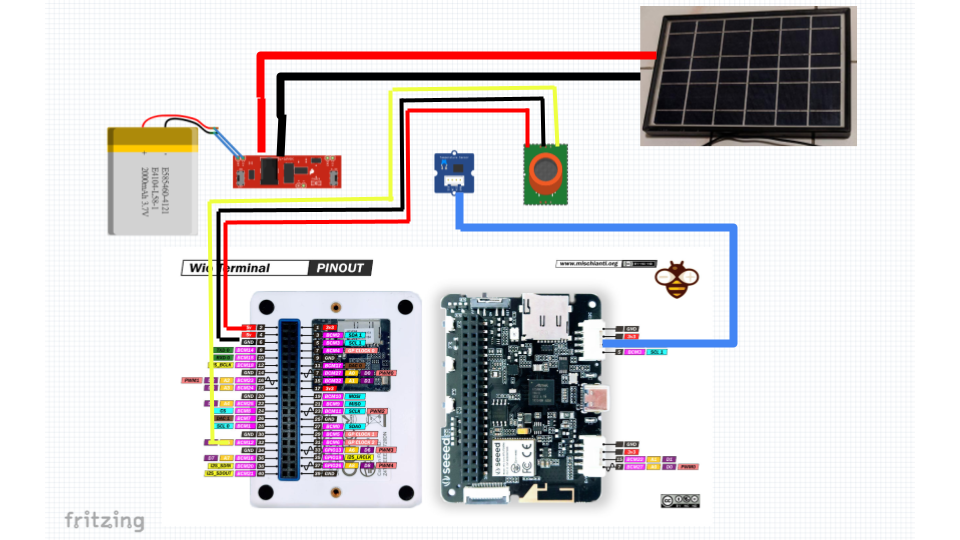
The solar power system consists of 3 parts: a solar panel, a 5V step-down module and a power storage. The setup is pretty straightforward, the solar panel I bought is 12V, so we need to step down to 5V for the Wio Terminal and sensors. The power storage is basically a powerbank with switch. And all we have to do is connect them together and plug in the USB.
I bought the 3 components from Taobao, for those of you who don't understand Chines, you can find them on AliExpress. I'm sure there are sellers for solar power systems in your region, so I won't include details of the suppliers
5. Connection
The connection for solar power system is explained above. The SHT40 sensor can be plugged in directly to Wio Terminal, while MQ4 sensor is a bit more difficult. We will connect the 5V, GND, and Analog Output to the corresponding pins; pin4, pin6 and pin32 among the 40 pins on the back of Wio Terminal. The pinout is copied here for your reference:
For more details, please scroll down and refer to the Schematic below.
6. Arduino Code
Just like every Arduino code, it has definition, setup() and loop(). The code can be further divided into 4 parts: take measurements, display the numbers on the Wio Terminal screen, upload to Blynk and calibration of R0 value.
Measurement
  error = sht4x.measureHighPrecision(temperature, humidity);
  if (error) {
    errorToString(error, errorMessage, 256);
    Blynk.notify(errorMessage);
  }
  rawCH4 = analogRead(gasPin);
  senVol = rawCH4 * 5 / 1023.0;
  senRes = ((5.0 * 10.0) / senVol) - 10.0; //Calculate RS in fresh air
  ratio = senRes / R0;
  ppm_log = m * log10(ratio) + C;
The first 5 lines of code read temperature and humidity from SHT40 sensor, and the later part reads analog signal (voltage level) from MQ4 sensor and then it's converted to concentration based on the graph in the datasheet.
The first step of conversion maps the 0-5V to 0-1023, then the sensor resistance is calculated based on the 0-1023 value. Finally, the sensor resistance is mapped onto the curve in the graph. By basic algebra formula: y = mx +c, we can find the "y" which is the concentration ppm of CH4.
R0 Calibration
  double sensor_volt; //Define variable for sensor voltage
  double RS_air; //Define variable for sensor resistance
  double sensorValue; //Define variable for analog readings
  for (int x = 0 ; x < 500 ; x++) //Start for loop
  {
    sensorValue = sensorValue + analogRead(A5); //Add analog values of sensor 500 times
  }
  sensorValue = analogRead(gasPin); //sensorValue / 500.0; //Take average of readings
  sensor_volt = sensorValue * (5.0 / 1023.0); //Convert average to voltage
  RS_air = ((5.0 * 10.0) / sensor_volt) - 10.0; //Calculate RS in fresh air
  R0 = RS_air / 4.4; //Calculate R0
One thing to note is the R0 value as the y-axis of the curve is actually Rs/R0. R0 is found by reading the sensor value in fresh air, converting it to sensor resistance and dividing it by 4.4 (the number is found in Fig. 2 of the datasheet, the curve of "Air"), similar to a calibration process. It should be done before entering the testing field. I've included the calibration code as CH4_calib() function, please uncomment it in the setup() when needed.
Display on Wio Terminal
For the layout of display, I like the design by Salman Faris a lot and thus took reference. I only adjusted the width of the rectangles and increase the decimal places to display.
Upload to Blynk
This is also very easy thanks to the Blynk library, you just need to send:
  Blynk.virtualWrite(V0, temperature);
  Blynk.virtualWrite(V1, humidity);
  Blynk.virtualWrite(V2, ppm_log);
  Blynk.virtualWrite(V3, R0);
7. Blynk Dashboard
This tutorial basically explains everything: https://wiki.seeedstudio.com/Wio-Terminal-Blynk/
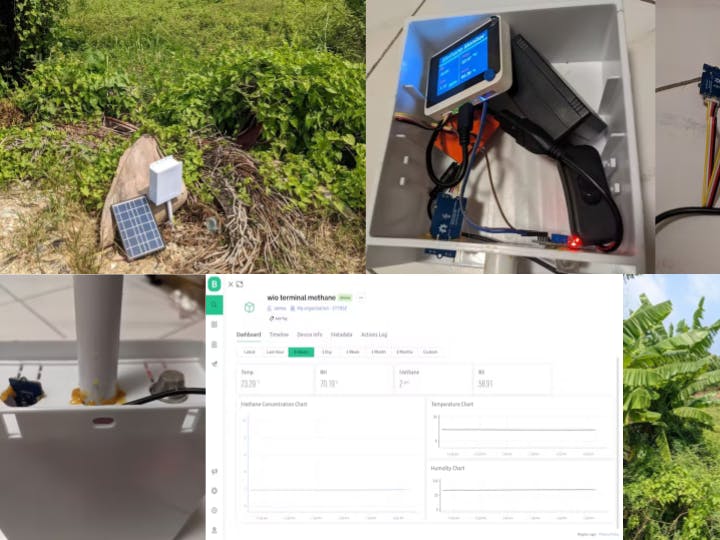
Just add the corresponding display to the different parameters, e.g. digital label for temperature, charts for Methane concentration. Please refer to the template below.
8. Casing
Here I used a waterproof box to put everything in, but Mithun Das has designed a very useful casing, which I suggest using his design to mount the Wio Terminal inside the box. The power storage should be smaller, but that's what I currently have in hand.
I popped holes underneath the box to place the sensors there, a PVC plastic tube is used as a supporting rod to make the box stand. Hot glue comes in handy to glue them in place.
9. Results
The concentration of CH4 I measured at home is 1.70ppm, which is acceptably close to the latest global value of around 1.80ppm. The R0 value was calibrated at home at approx. 30dec C and 65% R.H., I included the two measurements in the code to help with further finetuning of the Methane concentration with respect to the datasheet graphs.
Please also need that the MQ4 sensor usually gives a "spike" (something like 3-4ppm) each time it is powered up, it needs a "warm-up" of around 30 minutes before the reading stabilises to around 2ppm.
With everything ready, I brought my setup to one of the few paddy fields left in my city and see how the reading goes. Unfortunately, it's already September and they just harvested.
However, I found a new Wetland Park nearby which is currently "under construction" (Yes, a constructed wetland.... That is so Hong Kong...) When it opens later this year, I think I will come again and place the Monitoring Kit at both sites and see how the concentration of a paddy field compared to that of a wetland.
I understand that this simplified methane monitoring might not be scientific enough, but I hope that this is more like an inspiration and an entry-level kit for interested farmers or citizen scientists to start monitoring the concentration of methane in their surrounding environment. For more references on the methane generation in the paddy field and how to measure more scientifically, please refer to the following, and I'm sure there's a lot more on the Internet:
Handbook of Monitoring, Reporting, and Verification for a Greenhouse Gas Mitigation Project with Water Management in Irrigated Rice Paddies: https://www.naro.go.jp/publicity_report/publication/files/MRV_guidebook.pdf
Estimation of methane emission rates from a rice paddy field using a naturally ventilated tunnel: https://onlinelibrary.wiley.com/doi/pdf/10.1111/j.1744-697X.2012.00249.x
Emissions Of Greenhouse Gases From Rice Agriculture: https://www.osti.gov/servlets/purl/959124


Comments
Please log in or sign up to comment.