Toxic algal blooms (also called cyanobacteria or blue-green algae) can be harmful to both humans and animals alike. Blue green algae can grow in water that is warmer than usual (summer months), is slow moving, and is nutrient-rich (think fertilizer or sewage run-off). The algae can grow quickly, or "bloom". Once this happens, the algae has the potential to become toxic. Exposure to this algae can cause sickness in humans, and sickness and even death in pets and other animals. Also, because the algae uses oxygen from the water to grow, it can starve water-based animals (fish) from oxygen resulting in "dead zones" devoid of life.
I happen to live near a pond that is regularly impacted by algal blooms. In the heat of the summer, the water temperature can rise quickly, and runoff from local lawns or septic systems introduces nutrients into the water. What results is the perfect environment for blue green algae to grow. One summer, humans and their pets were directed to stay out of the pond for most of the summer due to the potential for sickness.
So, I set out to develop a monitoring system to collect data to see if I could get a baseline of the water and then track to see if variables are changing to determine risk for an algal bloom. I developed a water monitoring system that consists of several sensors:
- An Oxidative Reduction Potential (ORP) Sensor
- A Total Dissolved Solids (TDS) Sensor
- Water Temperature Sensor
- Air Temperature and Humidity Sensor
Ideally, I would have also used a pH sensor and a turbidity sensor, but those sensors were not readily available when I bought the other sensors.
I tied it all together with a Seeed Xiao RP2040 on a Xiao Grove shield. Data was sent to the cloud via a Blues Notecarrier B, and data visualized with Datacake. To finish it off, I provide power with a 5V solar panel, Seeed Lipo Rider Pro for solar power management, and a 3.7V 3700 mAh LiPo battery.
Sensor OverviewPer Seeed Studio's wiki:
An Oxidation Reduction Potential (ORP) Sensor measures the activity of oxidizers and reducers in an aqueous solution. It is a potentiometric measurement from a two-electrode system similar to a pH sensor. Sometimes it is also referred to as a redox measurement. Unlike a pH sensor, an ORP sensor measures the ratio of oxidized to reduced forms of all chemical species in solution.
The TDS Sensor, meanwhile, measures the total number of dissolved solids in the water sample (in parts per million - ppm) and gives an indication of water quality. The higher the value, the worse the water quality is.
The water temperature sensor and the air temperature/humidity sensors are straightforward. The water temperature sensor measures the water temperature (I chose Fahrenheit but can also do Celcius) and the air temperature/humidity measures the air temperature (also Fahrenheit) and humidity (a ratio of the actual amount of water vapor in the air compared to the total amount of vapor that can exist in the air at its current temperature - represented as a percentage).
Project BuildGiven that this project was going on the water, I tried to minimize the size of the components so they could fit in a waterproof enclosure that I had lying around. I went with the Seeed Studio Xiao RP2040 mounted to the Xiao Grove Shield, so I could connect multiple sensors easily together with the Grove interface. Even though all the sensors weren't Grove based, you can still use Grove to pin jumper to interface the sensor with the Grove shield. I chose to use the Blues Notecarrier B again because of its small footprint. I ran the sensor wires through an opening in the enclosure and sealed it up.
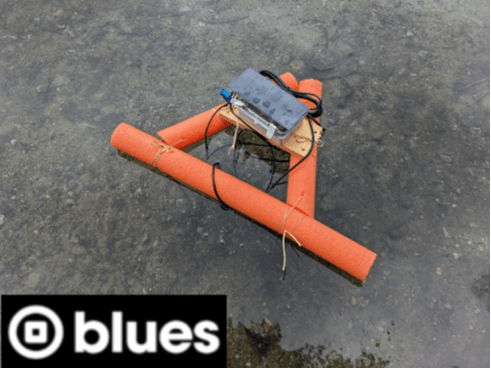
I then mounted the enclosure on a simple base, which was mounted to a pool noodle to provide buoyancy. The sensors hang in the water (with the exception of the air temperature and humidity sensor) to collect data.
I developed the code in the Arduino IDE, and routed the notehub data to Datacake. The dashboard can be seen below:
The only unfortunate thing that happened is that my water temperature sensor had stopped working during the pond test. I was getting values just hours before when testing at home, so not sure what went wrong.
If you look at the code, you see that I read values every 2 minutes. This was so I could get enough data to show the trend. In reality, you would want to sample much less frequently, perhaps once every several hours, as the change in value would happen over days not minutes.
Wrap-upThis was a fun project to implement. I was relieved that my float was sturdy enough to support the weight of the hardware, sensors, and enclosure. As you can see, mechanical design is not my strong suit haha. I hope you enjoyed this write-up and reach out with any feedback! Thanks!


Comments
Please log in or sign up to comment.