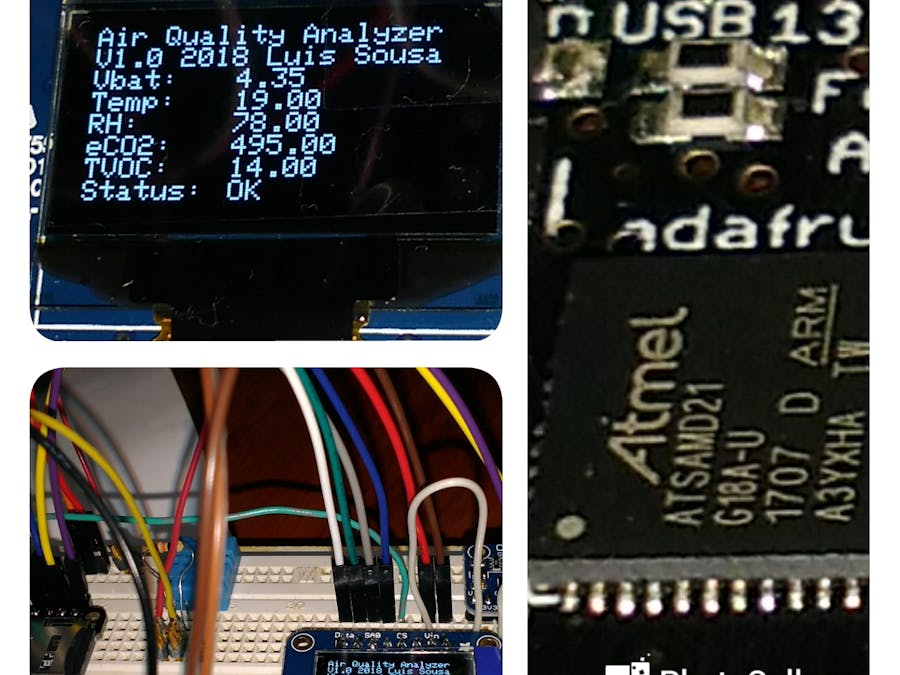
The quality of the air that we breathe, is very important to our health. This device analyses the air quality inside our homes, and records the values in a SD card. By analyzing the stored values, we know how the evolution of the parameters thru time was.
I will use temperature, humidity and air quality sensors that are cheap enough to use in this kind of project, without sacrificing too much the precision. The main idea behind this project is to know if the air is breathable or not.
The elected sensors are:
- DTH11 Temperature and humidity sensor, approx. $5.00 (not very accurate but good enough);
- CCS811 Air Quality Sensor module, approx $19.95.
I used Arduino Uno before, and I felt some memory limitations, so I decided to use a different board this time. As I need an SD card to record the values, the Adafruit Feather M0 Adalogger, was a perfect choice at a good price ($19.95):
- ATSAMD21G18 ARM Cortex M0 processor, clocked at 48 MHz / 3.3V logic
- 256KB of FLASH + 32KB of RAM
- Built in 100mA lipoly charger with charging status indicator LED
- MicroSD card holder
- light (5.3 grams)
- small (51mm x 23mm x 8mm)
I started by downloading the latest version of the Arduino IDE from https://www.arduino.cc/en/Main/Software choosing the windows installer. After the installation is complete, be sure to read carefully the Adafruit Feather M0 Adalogger user manual.
To be able to use Arduino IDE with this board, we have to configure the IDE as described in the Adafruit Feather M0 Adalogger user manual. Will be necessary to add a URL to the new Additional Boards Manager URLs option. Other simple actions are required, all of them described in the manual that can be found at:
With everything configured, (don't forget to select the right board and port on the IDE) lets do some simple test to check if everything is working. I used this code:
void setup() {
 pinMode(13, OUTPUT);// initialize digital pin 13 as an output.
}
void loop() {
 digitalWrite(13, !digitalRead(13)); // flash the LED with inverse value
 delay(500); // wait for a half a second
}
After sending this code to the FEATHER M0 ADALOGGER, I had no errors and the red LED on the board (connected to port 13 ) started flashing. Everything was OK.
Connecting the display:The first thing I connected to the board, was the OLED display. I strongly recommend that you read the display documentation available at https://cdn-learn.adafruit.com/downloads/pdf/monochrome-oled-breakouts.pdf
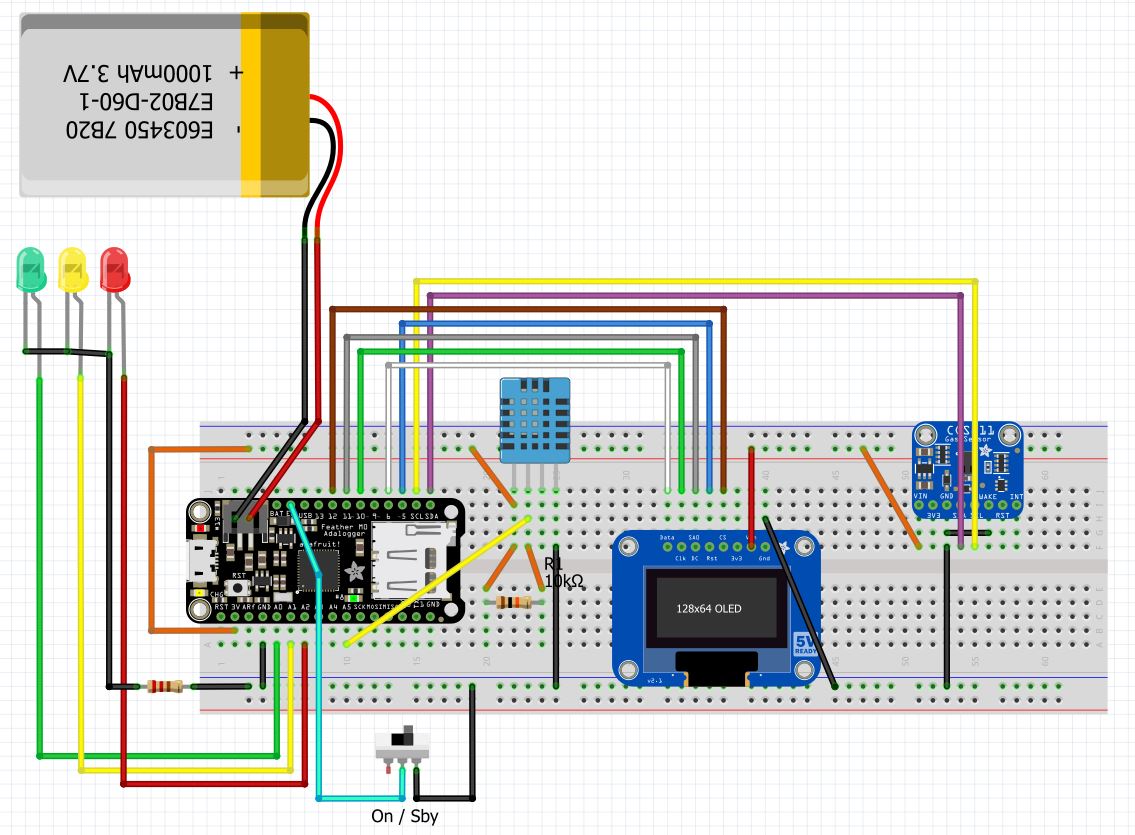
I connected the display pins to the processor board in this way:
- Display - > Board
- GND goes to ground
- Vin goes to 3V
- DATA to digital 6
- CLK to digital 10
- D/C to digital 11
- RST to digital 5
- CS to digital 12
Using the OLED Display documentation, Install Adafruit SSD1306 and Adafruit GFX Libraries. Restart the Arduino IDE.
Finally you can run the File→Sketchbook →Libraries→ Adafruit_SSD1306→ SSD1306_128x64_spi example
I had a compilation error complaining about an incorrect display height. This is because the library file SSD1306.h was generic and I had to edit it, to select the correct height of my display (64). Find the relevant lines and select the correct value by commenting the incorrect lines.
//   #define SSD1306_128_64
  #define SSD1306_128_32
//   #define SSD1306_96_16
I changed the default pins, because of some conflicts. So, I had to change the default code definitions in the example code, to match the pins I used:
#define OLED_MOSI   6
#define OLED_CLK   10
#define OLED_DC    11
#define OLED_CS    12
#define OLED_RESET 5
Adafruit_SSD1306 display(OLED_MOSI, OLED_CLK, OLED_DC, OLED_RESET, OLED_CS);
NOTE: Don't use pin digital 9 if you plan to use the battery voltage monitoring in A7. Digital 9 and A7 share the same pin. I found that in the hard way, after hours of bad Vbat readings and bad display behavior.
When the display works correctly you can proceed to the next section:
Connecting the Sensors:Connect DHT 11 according to the diagram. (Don't use the pin D13 on the board to read DHT11 data. Pin D13 has a LED connected permanently, it presents a low impedance and is not suitable for this kind of use).
We have to use one of the free digital pins. We excluded D9 because it conflicts with A7 used to read Vbat, and D13 because of the LED circuit. I will use D19 to connect to DHT11 pin 2, and read temperature and humidity via its one wire protocol. D19 is marked as A5 on the board, but can also be used as Digital 19. Don't forget to define DHTpin on software:
#define DHTPIN 19
CCS811 Connection:
- Vin goes to 3.3V line,
- GND goes to GND line,
- SDA goes to Adalogger SDA
- SCL goes to Adalogger SCL
- /WAKE goes to GND
I used Adafruit_CCS811 library version=1.0.0 and everything works fine.
SD CardTo be able to record the values thru time, I used an old 512MB uSD card. This Adalogger board is fantastic because it already has a uSD Card slot. I use here the Arduino library version 1.2.2. and the pin D4 as the CS pin for SD. In the next figure i show the format os the data in SD Card. It is comma separated, in order to be opened by spreadsheet software for analysis.
In this example, data is being recorded every 5 minutes (300 seconds). This value of time is easily changed in software, by changing line:
#define SD_write_interval 300 //seconds between SD writes
Replace 300 by the number of seconds you want between SD writes. That simple.
The file is in csv format (comma separated values) meaning that all values are separated by commas. It can be easily imported by a spreadsheet to further analysis.
RTCA time stamp is essencial for the data-logger. For now, I'm using and evaluating the internal RTC with RTCZero library.
#include <RTCZero.h> //author=Arduino version=1.5.2
#include <RTClib.h> //author=Adafruit version=1.2.1
However i use RTClib as a complement. For the RTC initialization I use the folowing code:
 //RTC initialization
 DateTime now;
 now = (DateTime(F(__DATE__), F(__TIME__))); //compile time
 now=now+20; //20s compensation for Compile + Reset time
 rtc.begin(); // initialize RTCZero
 rtc.setTime(now.hour(), now.minute(), now.second());
 rtc.setDate(now.day(), now.month(), now.year()-2000);
The next thing to do is to find a way to adjust the time. Stay tuned!
The LEDsIf the user don’t know what are the limits of all those air quality parameters, and don't care about the numbers, probably is better to tell him just if they are safe or not. Using 3 LEDs is a simpler interface and more useful if the user just wants to know if he/she can breathe that air. That was the reason why I decided to implement these 3 LEDs with different levels of alarm: Green,Yellow, or Red. The levels that trigger each alarm are programmable according local regulations. To change the levels just edit the following lines of code:
//Levels
//temp levels
#define low_temp_level_1 18
#define low_temp_level_2 12
#define low_temp_level_3 8
#define high_temp_level_1 29
#define high_temp_level_2 35
#define high_temp_level_3 40
//rh levels
#define low_rh_level_1 40
#define low_rh_level_2 30
#define low_rh_level_3 20
#define high_rh_level_1 70
#define high_rh_level_2 80
#define high_rh_level_3 90
//co2 levels
#define co2_level_1 1000
#define co2_level_2 1500
#define co2_level_3 3000
//TVOC levels
#define tvoc_level_1 100
#define tvoc_level_2 500
#define tvoc_level_3 1000
The values shown are just indicative and i´m using them just to test purposes
GO!Well, i'm still in the evaluation phase, and hoping someone wants to build a similar circuit to help me improve this useful data logger.
Lets download the code and have some fun, reading those CO2 values. I had to open some windows to improve air quality :)
Don't forget to wait 20 minutes after power on, for good CCS811 readings. (The CCS811 also needs 48 hours of burnin time before first use. )
Have fun


Comments
Please log in or sign up to comment.