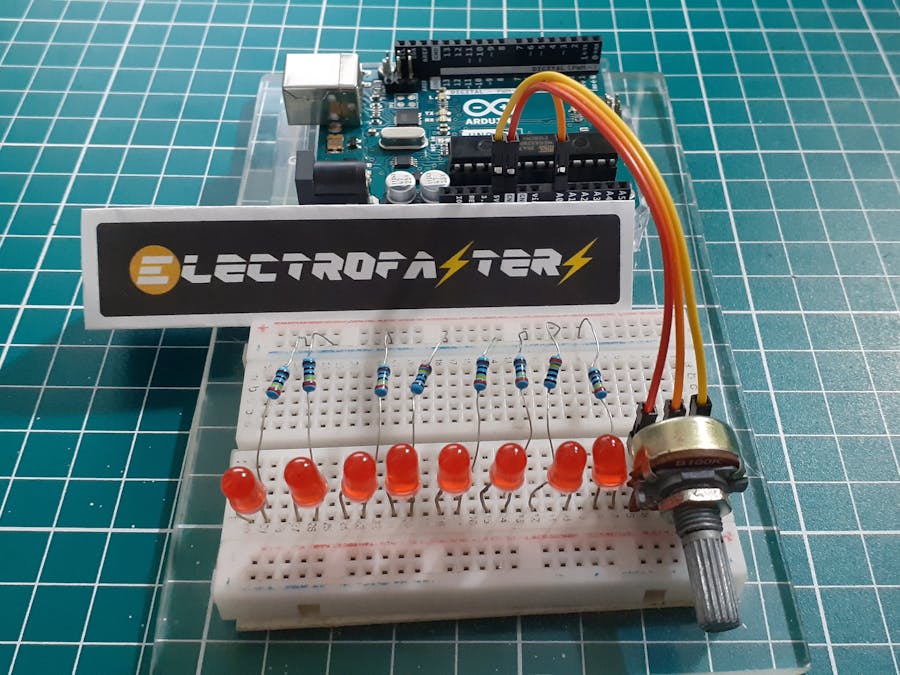
This project is focused on the realization of a graphic representation of the value of a potentiometer using eight LEDs. I find it interesting that a scale can be generated using a series of LEDs despite not being shown numerically, I hope you find it a bit of fun and can share any changes you can identify.
Using Arduino IDEActually in this section there is nothing new besides all the information that is even provided by Arduino. For any new explorer, the connections are totally simple, the important thing is that the output of the analog value must be established through the serial port.
The code is simplified, important is the connection of the middle connector of the potentiometer on pin A0.
int sensorValue = 0;

void setup()
{
  pinMode(A0, INPUT);
  Serial.begin(9600);

}

void loop()
{
  sensorValue = analogRead(A0);
  delay(500); // Wait for 500 millisecond(s)
  Serial.println(sensorValue);
}
You can enter and perform the simulation from the following link: Circuit 1
Using LEDsTo understand my idea (and that you can add any other in the comments), I was guided by a very simple formula:
For those who can notice that the idea is not to use mathematics to complicate the application and taking into account that the Arduino people noticed that. We have a function that allows us to perform the interpolation with a single function:
map(value, fromLow, fromHigh, toLow, toHigh)All official information can be found at the following link: Arduino Reference - Map
Explanation of magicRegister the numbers of the connection pins in an array.
const byte LED[8] = {2,3,4,5,6,7,8,9};Activate serial communication and name the outputs for each LED.
void setup() {
  Serial.begin(9600);
  // Output for each LED
  for (int i=0; i<8; i++) {
    pinMode (LED[i], OUTPUT);
  }

}
Into the Loop, reads the value of the potentiometer and uses the MAP function, uses a FOR loop to turn off the LEDs, then checks if there is a value greater than 0 to turn on the number of LEDs based on the calculated value.
void loop() {
  int value = analogRead(A0); // read of potentiometer value
  int nivel = map(value, 0, 1010, 0, 8); // map function to get brihtness
  for (int i=0; i<8; i++) {
    digitalWrite(LED[i] , LOW);
  }
  if (nivel > 0) {
    for (int i=0; i<nivel; i++) {
      digitalWrite(LED[i] , HIGH);
    }
  }
  Serial.println(nivel);
  delay(100);
}
Now, build the connections below, connect your Arduino, and upload the code. You can perform the simulation in the following link: ThinkerCAD-Sim
Conclusion
The representation that I am using is completely graphical, despite sending the value to the serial communication, any user would be guided by the LEDs to establish a control, for this we must take into account that numerically there are obvious errors. I love making simple representations to easily understand and even make changes. I hope that the information that I present to you will be very useful for your future ideas.


_ztBMuBhMHo.jpg?auto=compress%2Cformat&w=48&h=48&fit=fill&bg=ffffff)


_t9PF3orMPd.png?auto=compress%2Cformat&w=40&h=40&fit=fillmax&bg=fff&dpr=2)
Comments
Please log in or sign up to comment.