Objective
Forest fires help in the natural cycle of woods' growth and replenishment. They Clear dead trees, leaves, and competing vegetation from the forest floor, so new plants can grow. But when fires burn too hot and uncontrollable or when they’re in the “wildland-urban interface” (the places where woodlands and homes or other developed areas meet), they can be damaging and life threatening.
In this project, our aim is to predict the burned area area of forest fires on the the spatial, temporal, and weather variables where the fire is spotted.This prediction can be used for calculating the forces sent to the incident and deciding the urgency of the situation.
Data set
For this project, I going to usded the data set from Kaggle Forest Fires Data Set that included longterm metric such as FFMC(Fine Fuel Moisture Code) , DMC(Duff Moisture Code), ISI(Initial Spread Index), and DC(Drough Code). These metrics is calculated based on temperature, humidity, wind, and rain over period of weeks or month. They are essential in building an accurate model to predict the burned area.
Wiring and Peripherals
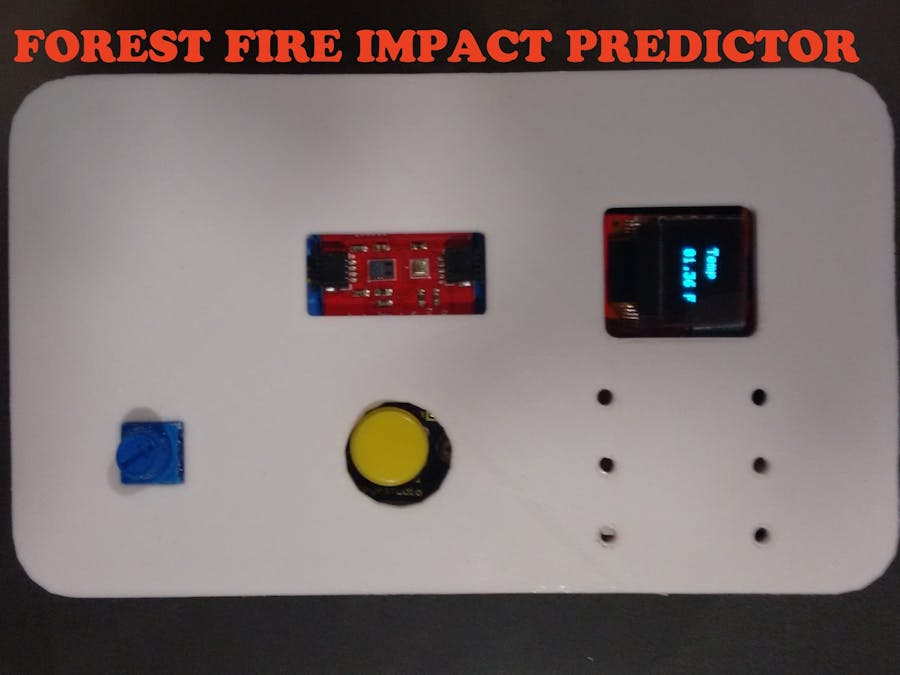
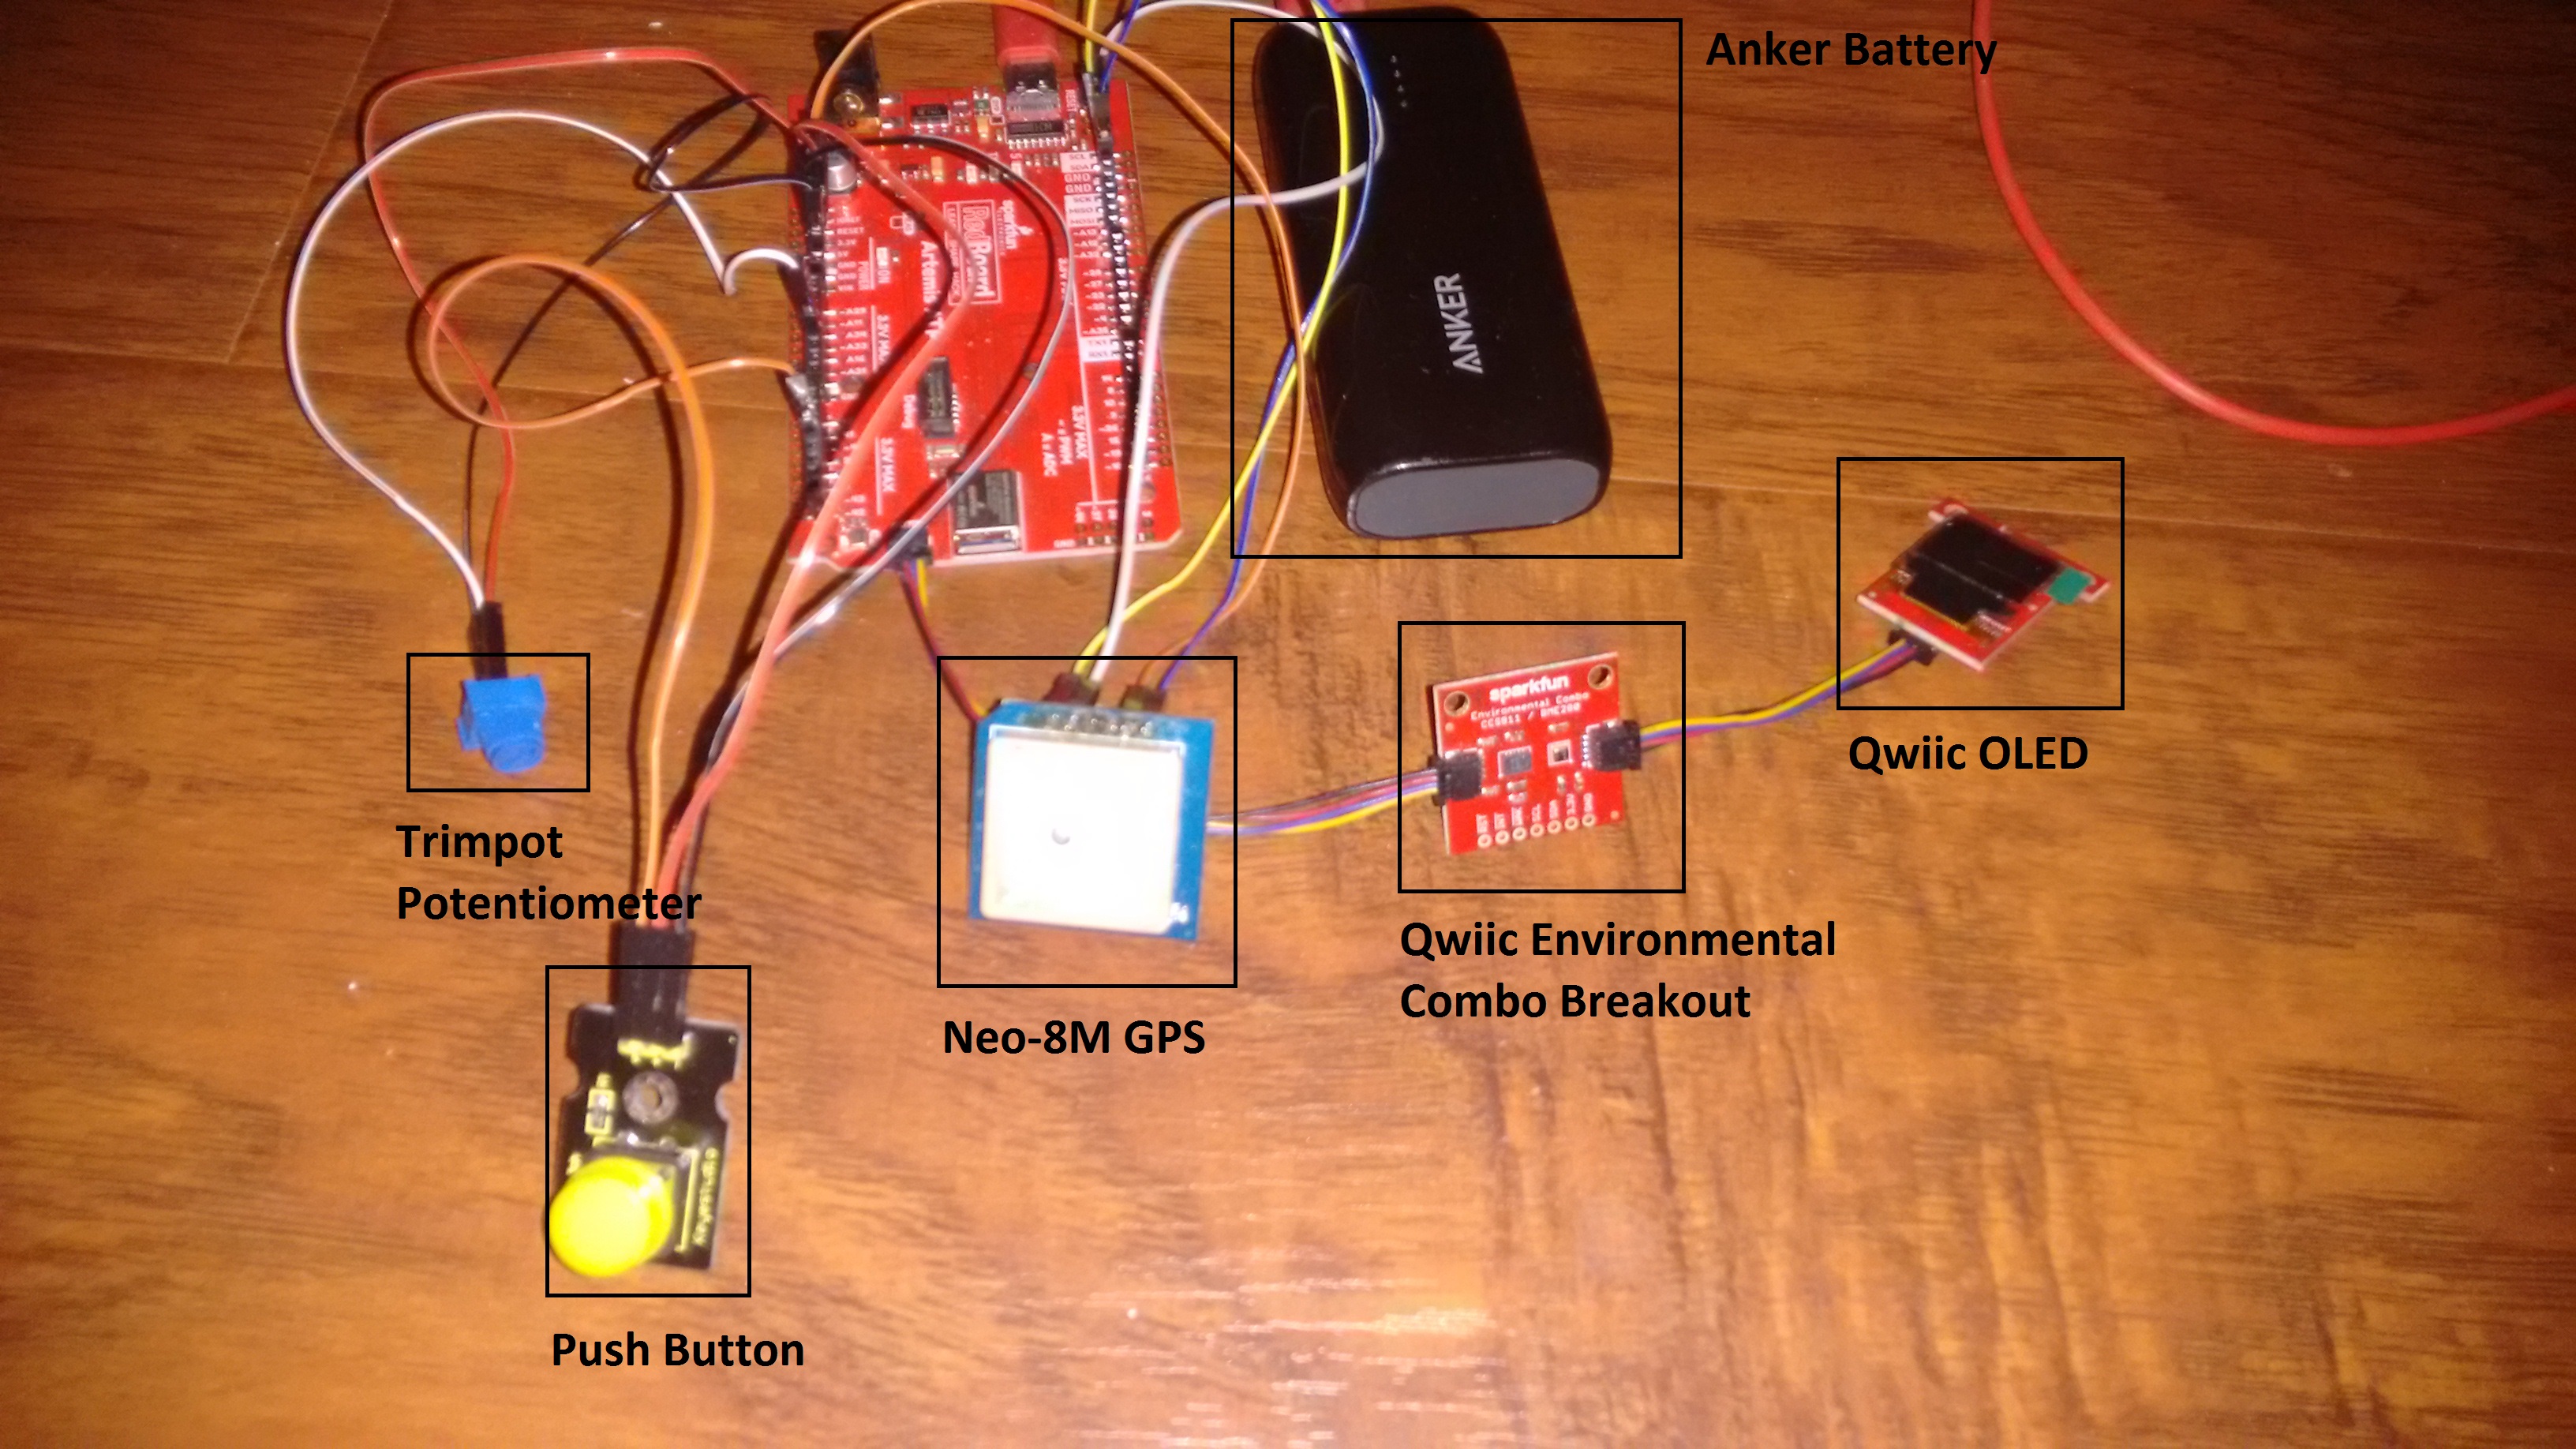
In this project, the main power supply going to be the portable 5600 mAH Anker battery. The Qwiic Environmental Breakout Board going to be use to collect realtime data such as humidity, temperature, pressure, etc. The Qwiic OLED going be use to display data and serve as part of the menu system. The GPS provided coordinate to allowed the system to select the correct FFMC, DMC, DC, and ISI valued from it internal database. Finally, the push button and potentiometer serve as a way for the user to select various menu options.
This section will be relatively short as there not much going in wiring. The two Qwicc module will be connected using the Qwiiic cable and the Artemist ATP Qwiic Connector. The potentiometer will be using the 3.3V as VCC and Pin 16 to output it;s signal. GPS module will use the RX1 and TX1 to communicate with the Artemist ATP in UART . Finally, the Push button will use Pin 2 to output it's signal and it's will used 5V pin for VCC.
Building the Model
The model going to be build using the Tensorflow 2.2 and later will be ported into TensorflowLite once the training and validation is completed.
target = 'area'
Features          = ['FFMC','DMC','DC','ISI','temp','RH','wind']
TrainingSetLabels = ['FFMC','DMC','DC','ISI','temp','RH','wind','area']
path = 'forestfires.csv'
path = "forestfires.csv"
df = pd.read_csv(path)
The first few pieces of code store data into the Dataframe object as well as define the training features(input) and the the output in this case is the area(burned area)
df = pd.read_csv(path)
df.shape
df.dtypes
df.describe().T
df.isna().sum().sum()
plt.rcParams["figure.figsize"] = 9,5
# Outlier points
y_outliers = df[abs(zscore(df[target])) >= 3 ]
y_outliers
dfa = df.drop(columns=target)
cat_columns = dfa.select_dtypes(include='object').columns.tolist()
num_columns = dfa.select_dtypes(exclude='object').columns.tolist()
cat_columns,num_columns
This piece of code make sure that to remove any data that is not a number, , remove outliers, and put data into categorical column and numerical column to plotting.
plt.figure(figsize=(20,40))
for i,col in enumerate(num_columns,1):
    plt.subplot(10,1,i)
    if col in ['X','Y']:
        sns.swarmplot(data=df,x=col,y=target,hue='damage_category')
    else:
        sns.scatterplot(data=df,x=col,y=target,hue='damage_category')
plt.show()
We can than graph the individual feature data against burned area to better see their distribution. The resulting graph is show below :
From these graph we see that there low correlation between rain and burned area in this data set so I will simply remove the rain categories. In addition, We had observed outliers in FFMC, DC, and burned area.
#Preparing Data
df = pd.get_dummies(df,columns=['day','month'],drop_first=True)

#FFMC till having high skew and kurtosis values,
# since we will be using Linear regression model we cannot operate with such high values
# so for FFMC we can remove the outliers in them using z-score method
mask = df.loc[:,['FFMC']].apply(zscore).abs() < 3

# Since most of the values in rain are 0.0, we can convert it as a categorical column
df['rain'] = df['rain'].apply(lambda x: int(x > 0.0))
df = df[mask.values]
df.shape
out_columns.remove('rain')
df[out_columns] = np.log1p(df[out_columns])
df[out_columns].skew()
# we will use this dataframe for building our ML model
df_ml = df.drop(columns=['damage_category']).copy()
training_set = df[TrainingSetLabels]
This take care of the outlier and normalize the data for training. Finally, it copy all the desired training data to variable training_set. I going to feed training set into the linear regression model next.
train_dataset = training_set.sample(frac=0.8,random_state=0)
print(train_dataset)

test_dataset = training_set.drop(train_dataset.index)
print(test_dataset)

train_stats = train_dataset.describe()
train_stats.pop("area")
train_stats = train_stats.transpose()
train_stats

train_labels = train_dataset.pop('area')
test_labels = test_dataset.pop('area')
Before we train the data we must first split the data into training and testing set as well as putting in the burned area (the predicted value) into it own variable.
def build_model():
    model = keras.Sequential([
        layers.Dense(16, activation='relu', input_shape=[len(train_dataset.keys())]),
        layers.Dense(16, activation='relu'),
        layers.Dense(1)
    ])
    optimizer = tf.keras.optimizers.RMSprop(0.001)
    model.compile(loss='mse',
                  optimizer=optimizer,
                  metrics=['mae', 'mse'])
    return model

model = build_model()
This code build our model which had 3 layers with the first 2 layer had 16 hidden node and the last layer had 1 node since we only have one class that we need to prediction
The loss model is going to be base on MSE( Mean Squared Error) this tell the Tensorflow that we going to use linear regression in our model.
EPOCHS = 1000

# The patience parameter is the amount of epochs to check for improvement
early_stop = keras.callbacks.EarlyStopping(monitor='val_loss', patience=10)
early_history = model.fit(normed_train_data, train_labels,
epochs=EPOCHS, validation_split = 0.2, verbose=0,
callbacks=[early_stop, tfdocs.modeling.EpochDots()])

test_predictions = model.predict(normed_test_data).flatten()
print(test_predictions)

model.save('saved_model/my_model')
I going to train my model for around 1000 epoch but the training code will automatically stop early if the training loss value doesn't deviate much from one step to the next.
import tensorflow as tf
converter = tf.lite.TFLiteConverter.from_saved_model('saved_model/my_model')
tflite_model = converter.convert()
open("converted_model.tflite", "wb").write(tflite_model)
In order to convert to TensorflowLite code, we going to use the following code snipet provided on TensorflowLite website to convert your Tensorflow model into TensorflowLite format.
# Install xxd if it is not available
apt-get -qq install xxd
# Save the file as a C++ source file
xxd -i model.tflite > model.cpp
Finally, I use the following two command to convert the .tflite model file into c++ file in order to deploy the model on the Artemis Redboard ATP.
OLED Display
In order to display data and navigation easier, I am going to use the Qwiic OLED, push button and potentiometer to create a display and navigation system. This display and navigation system going to follow the state machine as show below.
Below is an implementation going for Weather to Display to Predict Burn Area state as example. The full implementation can be found in the code repo. This include setting up the OLED, push button, and potentiometer.
#include <Wire.h>  // Include Wire if you're using I2C
#include <SFE_MicroOLED.h>  // Include the SFE_MicroOLED library
#define PIN_RESET 9
#define DC_JUMPER 1
#define ROTARY_ANGLE_SENSOR A16

MicroOLED oled(PIN_RESET, DC_JUMPER);    // I2C declaration

const int buttonPin = 2;     // the number of the pushbutton pin
int state = 0;
int buttonState = 0;

void setup(void)
{
  Serial.begin(9600);
  pinMode(ROTARY_ANGLE_SENSOR, INPUT);
  pinMode(buttonPin, INPUT);

  delay(100);
  Wire.begin();

  oled.begin();    // Initialize the OLED
  oled.clear(ALL); // Clear the display's internal memory
  oled.display();  // Display what's in the buffer (splashscreen)
  delay(1000);     // Delay 1000 ms
  oled.clear(PAGE); // Clear the buffer.
}

void loop(void)
{
   switch(state)
   {
    case 0: state0(); break;
    case 1: state1(); break;
    case 2: state0(); break;
    case 3: state1(); break;
    case 4: state0(); break;
   }
}

//Weather Data
void state0()
{
  buttonState = digitalRead(buttonPin);
  int sensor_value = analogRead(ROTARY_ANGLE_SENSOR);
  if(sensor_value < 500)
  {
    oled.clear(PAGE); // Clear the buffer.
    oled.setFontType(0); // set font type 0
    oled.setCursor(15, 10);
    oled.print("Weather     Data");
    oled.display();
    if (buttonState == HIGH) {state = 1;}
  }
  else
  {
    oled.clear(PAGE); // Clear the buffer.
    oled.setFontType(0); // set font type 0
    oled.setCursor(3, 10);
    oled.print("Prediction");
    oled.display();
    if (buttonState == HIGH) {state = 2 ;}
  }
}
//Display Data
void state1()
{
  buttonState = digitalRead(buttonPin);
  int sensor_value = analogRead(ROTARY_ANGLE_SENSOR);
  oled.print("Temp =");
  oled.setCursor(1, 12);
  oled.print(myBME280.readTempF());
  oled.print(" *F");
  oled.setCursor(1, 21);
  oled.print("Humidity =");
  oled.setCursor(1, 30);
  oled.print(myBME280.readFloatHumidity());
  oled.display();
  if (buttonState == HIGH) {state = 0 ;}
}

//Predict Burn Area
void state2()
{
    buttonState = digitalRead(buttonPin);
    int wind_speed = analogRead(ROTARY_ANGLE_SENSOR);
    oled.clear(PAGE); // Clear the buffer.
    oled.setFontType(0); // set font type 0
    oled.setCursor(15, 10);
    oled.print("Wind     Speed");
    oled.setCursor(15, 30);
    oled.print(wind_speed);
    oled.display();
    if (buttonState == HIGH) {state = 3 ;}
}
Gathering Real Time Data : Temperature and Humidity,
For temperature and humidity, I going to use the Qwiic Environmental Breakout Board to collect these data. This module will be connected to the Artemis ATP using Qwiic Connector.
Below is a piece is the process of using the Qwiic Environmental Breakout Board on the Arduino
#define CCS811_ADDR 0x5B //Default I2C Address
CCS811 myCCS811(CCS811_ADDR);
BME280 myBME280;
float humidity = 0;
float temperature = 0;

void setup(void)
{
  Serial.begin(9600);
  //Initialize BME280
  //For I2C, enable the following and disable the SPI section
  myBME280.settings.commInterface = I2C_MODE;
  myBME280.settings.I2CAddress = 0x77;
  myBME280.settings.runMode = 3; //Normal mode
  myBME280.settings.tStandby = 0;
  myBME280.settings.filter = 4;
  myBME280.settings.tempOverSample = 5;
  myBME280.settings.pressOverSample = 5;
  myBME280.settings.humidOverSample = 5;
  //Calling .begin() causes the settings to be loaded
  delay(10);
  //Make sure sensor had enough time to turn on. BME280 requires 2ms to start up.
  byte id = myBME280.begin(); //Returns ID of 0x60 if successful
  if (id != 0x60)
  {
    Serial.println("Problem with BME280");
  }
  else
  {
    Serial.println("BME280 online");
  }
}

void loop(void)
{
  ReadDataEnviromental();
}

void ReadDataEnviromental()
{
  if (myCCS811.dataAvailable())
  {
    //Calling this function updates the global tVOC and eCO2 variables
    myCCS811.readAlgorithmResults();
    myCCS811.setEnvironmentalData(BMEhumid, BMEtempC);
  }
  delay(1000);
  temperature = myBME280.readTempF();
  humidity    = myBME280.readFloatHumidity();
}
In the setup loop, the code start by initialize I2C connection with Qwiic Environmental Breakout Board and check to see if they are online. Next, the cide run the ReadDataEnviromental() inside void loop() to collect humidity and temperature data. Inside ReadDataEnviromental(), the code fuse CCS811 and BME280 data together and output temperature and humidity to it's respective global variable.
Gathering Real Time Data : Wind
For wind data, I decided to simply let the user to manually because adding a wind speed sensor would make the system too bulky and reliable wind sensor cost upward of around hundred of dollar. The user going input the wind speed via a potentiometer and using a push button to confirm the value.
#define ROTARY_ANGLE_SENSOR A16 // Potentiometer pin
const int buttonPin = 2;        // Pushbutton pin
int wind = 0;                   //global variable for wind speed

void setup(void)
{
  ...
  //Define pin
  pinMode(ROTARY_ANGLE_SENSOR, INPUT);
  pinMode(buttonPin, INPUT);
  ...
}

void loop(void)
{
  ....
  ReadWind();
  ...
}

void ReadWind()
{
  buttonState = digitalRead(buttonPin);
  int sensor_value = analogRead(ROTARY_ANGLE_SENSOR);
  if (buttonState == HIGH) {wind = sensor_value;}
}
This code simply declare pin 16 as potentiometer input and pin 2 for push button input and declare them as an input in setup(). In loo(), the code call ReadWind() function. Inside ReadWind(), code check for push button and potentiometer value and when push button is High ( being pressed ) we set potentiometer value = wind speed.
Gathering Real Time Data : DMC,DC,DFC,ISI
For DMC,DC,DFC, and ISI value we going to import the latest value from using the and store this value inside a custom made library. The data can be obtain from Nasa database. Below is an example using DMC.
float DMC[21][18] =
{
    {0, 0, 0, 0, 0, 0, 0, 0, 0, 0, 0, 0, 22.9, 19.6, 824.5, 58.2, 839.5, 468.4},
    {0, 0, 0, 0, 0, 0, 0, 0, 0, 0, 0, 0, 16.5, 18.3, 59.9, 38.9, 828.5, 590.3},
    {0, 0, 0, 0, 0, 0, 0, 0, 0, 0, 0, 16.4, 13.5, 22.1, 61.7, 888.5, 803.5, 632.8},
    {0, 0, 0, 0, 0, 0, 0, 0, 0, 0, 18.4, 18.1, 16.9, 26.4, 745.3, 781.9, 730.1, 566.        5},
    {0, 0, 0, 0, 0, 0, 0, 0, 217.4, 14.3, 17.2, 16.8, 19.9, 26.6, 730.3, 656.2, 58.6, 21.6},
    {0, 0, 0, 0, 0, 0, 13.6, 12.6, 13.1, 13.5, 13.5, 14.3, 15.3, 35.1, 609.1, 37.6, 29.9, 23},
    {0, 0, 0, 0, 0, 0, 11.3, 12.6, 13.7, 11.2, 22.3, 19, 29.8, 29, 517.3, 24.8, 29.1, 16.7},
    {0, 0, 0, 0, 0, 435.9, 10.4, 16.4, 27.2, 22.9, 35.1, 36.8, 15.8, 30, 41.7, 42.5, 16.5, 14.5},
    {0, 0, 0, 0, 416.7, 310.2, 420.6, 16.6, 40, 21.5, 41, 67, 22, 15.9, 26.8, 23.3, 14.1, 11},
    {0, 0, 0, 0, 327.8, 323.9, 463.5, 18, 38.1, 0, 0, 0, 30.7, 10.6, 9.7, 15.3, 23.6, 10.6},
    {0, 0, 0, 0, 255.2, 11.7, 20, 21.1, 37.4, 0, 0, 57.4, 46.5, 0, 22.9, 22.9, 14.1, 0},
    {0, 0, 0, 321.6, 328.8, 10.3, 19.5, 0, 0, 0, 0, 0, 0, 0, 0, 0, 0, 0},
    {0, 0, 180.8, 324.8, 265.9, 12.1, 0, 0, 0, 0, 0, 0, 0, 0, 0, 0, 0, 0},
    {0, 0, 84, 230, 205.6, 2.7, 0, 0, 0, 0, 0, 0, 0, 0, 0, 0, 0, 0},
    {0, 3.6, 4.2, 5.4, 5.4, 7, 0, 0, 0, 0, 0, 0, 0, 0, 0, 0, 0, 0},
    {0, 2.5, 7.2, 3.2, 10.8, 0, 0, 0, 0, 0, 0, 0, 0, 0, 0, 0, 0, 0},
    {3.9, 3.8, 10.9, 7.7, 8.6, 0, 0, 0, 0, 0, 0, 0, 0, 0, 0, 0, 0, 0},
    {2.7, 0, 0, 0, 0, 0, 0, 0, 0, 0, 0, 0, 0, 0, 0, 0, 0, 0},
    {3, 0, 0, 0, 0, 0, 0, 0, 0, 0, 0, 0, 0, 0, 0, 0, 0, 0},
    {1.8, 0, 0, 0, 0, 0, 0, 0, 0, 0, 0, 0, 0, 0, 0, 0, 0, 0},
    {1.8, 0.5, 0, 0, 0, 0, 0, 0, 0, 0, 0, 0, 0, 0, 0, 0, 0, 0}
}
For DMC, DC, DFC, and ISI data, I only take value from coordinate 32- 41 longitude and -124 - -115 lattitude. The reason i choose this set of coordinate because it cover the entire state of California and main goal of this project is predicting forest fire impact in California.
Now, the system need to figure out a way to extract these value based on it's current location. There is a GPS module inside the system and below is an example code showing how to get the correct DMC value with respect to the current location
float longitude, latitude ;
int x , y;

...

if( (longitude > 32 && longitude > 41) && ( latitude > -124 && latitude < -115) )
{
    //round to nearest .5
    longitude = (floor((longitude*2)+0.5)/2);
    latitude  = (floor((latitude*2)+0.5)/2);
    //
    x = longitude - 32;
    y = latitude  + 124;
{
else
{
    //outside valid coordinate
    Serial.println("Outside valid coordinate");
    return;
{
...
//input DMC into the model
input->data.f[1] = DMC[x][y];
The above piece of code check to make sure that the system is within the valid coordinate. Then, it round the longitude and latitude value to nearest .5 and remap it from 0 - 18 so it can these coordinate can be use in the our DMC 2d array.
Deploying Model on Artemis ATP
First step to get machine learning on the Artemis ATP is installing the Arduino_Tensorflow library using the library manager in the Arduino IDE. Once the library is installed, create a model.h file for your model.cpp and put them under the Document/Arduino/libraries/model
Define the following variable at the outside of the main and void loop. These are structure template for the Tensorflow in Arduino.
// Globals, used for compatibility with Arduino-style sketches.
namespace {
    tflite::ErrorReporter* error_reporter = nullptr;
    const tflite::Model* model = nullptr;
    tflite::MicroInterpreter* interpreter = nullptr;
    TfLiteTensor* input = nullptr;
    TfLiteTensor* output = nullptr;
    // Create an area of memory to use for input, output, and intermediate arrays.
    constexpr int kTensorArenaSize = 21 * 1024;
    uint8_t tensor_arena[kTensorArenaSize];
}
The next piece of code will be in the setup(). These simply setup the model, memory structure, and necessary operator for your model
void setup(){
    .....
    // Pull in operation implementations we need.
    static tflite::ops::micro::AllOpsResolver resolver;
    // Build an interpreter to run the model with.
    static tflite::MicroInterpreter static_interpreter( model,
                                                        resolver,
                                                        tensor_arena,
                                                        kTensorArenaSize,
                                                        error_reporter);
    interpreter = &static_interpreter;
    //Assign Memory to tensor Area
    TfLiteStatus allocate_status = interpreter->AllocateTensors();
    //Set Input and Output variable
    input = interpreter->input(0);
    output = interpreter->output(0);
    .....
}
These piece of code will be in the loop() section. Here, you simply feeding data into the input, run the model, and read value from the output.
void loop(){
    //Other code
    ......
    //Read in local FFMC value (x = longitude, y= lattitude)
    input->data.f[0] = FFMC[x][y];
    //Read in local DMC value (x = longitude, y= lattitude)
    input->data.f[1] = DMC[x][y];
    //Read in local DC value (x = longitude, y= lattitude)
    input->data.f[2] = DC[x][y];
    //Read in local ISI value (x = longitude, y= lattitude)
    input->data.f[3] = ISI[x][y];
    //Read in local temp value
    input->data.f[4] = temperature;
    //Read in local humidity value
    input->data.f[5] = humidity;
    //Read in local wind value
    input->data.f[6] = 6;
    // Run the model on the spectrogram input and make sure it succeeds.
    TfLiteStatus invoke_status = interpreter->Invoke();
        if (invoke_status != kTfLiteOk) {
        error_reporter->Report("Invoke failed");
        return;
    }
    burned area = output->data.f[0];
}
The full implementation the building and training in Tensorflow as well as the implementation in Artemist ATP can be found in the Gibhub repo below.
Demo
The demo include three parts:
- The first one i tested under high temperature with moderate wind speed.
- The second was tested with high temperature and high wind speed
- The last one tested with moderate temperature and no wind speed
Overall, the result show that higher temperature with higher wind speed tend to create a much bigger burned area than weather condition with high temperature but with light wind.


Comments