Indoor Air quality (IAQ) depends on numerous factors which includes the following:
- Temperature: if the temperature is too hot or too cold indoor, it can create discomfort and can impact both our physical and mental health. For example, it can lead to respiratory distress, sleep deprivation and/or depression.
- Humidity: depending on the humidity levels indoor, people are more susceptible to airborne pollutants such as allergens, mold, mildew, and viruses. It also directly impacts the comfort.
- Particles: PM2.5 are particles of a diameter of 2.5 micrometres or smaller. Due to their size, they are inhalable and are small enough to pass through the lungs, into the bloodstream, and into your organs. High continuous exposure can lead to premature mortality and respiratory diseases. The main sources are dust, smoke and fuel combustion.
- VOCs presence: VOC stands for Volatile organic compounds. They are gases containing different chemicals that can be harmful but not all of them are. For example, cleaning agents, paint and fuels are VOCs. For health and smell, it is recommended to ventilate the room if high levels are detected.
Those factors and their consequences can be pretty scary, but my idea is to enable people to monitor their indoor air quality with as less stress as possible. As a user, I am sometimes stressed and overwhelmed by numbers, especially when it is hard to tell if they are good or bad. Same way, red/orange/green type of interfaces stress me out because red and orange colors create a sense of urgency and very bad situation feelings while most of the times, it just indicates that a window needs to be opened or the HVAC system needs to be adjusted a little bit.
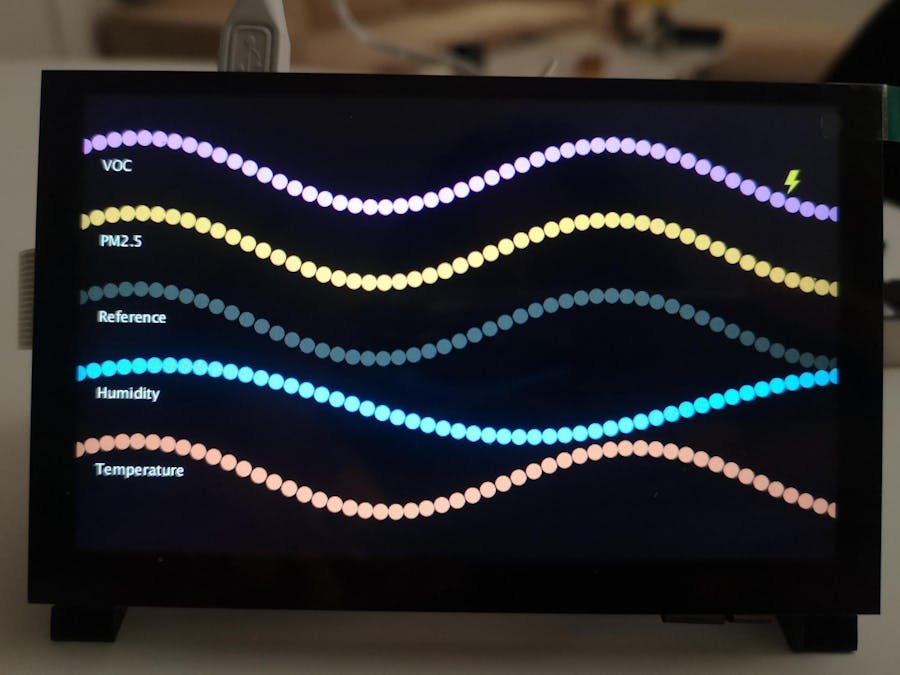
That's why I chose sinusoidal curves to represent each factor. The higher the frequency means the higher the value compared to a reference curve. If the value is on the low side, the frequency will be lower than the reference curve.
Example below: The blue curve which is humidity has a lower frequency that the reference: it means that it would be a good idea to turn on the humidifier. No numbers, no red colors, just the user seeing a curve smoother than another one and who can associate it with a simple action item. All other factors are in sync with the reference curves.
Another example: The pink curve which is VOC has a higher frequency than the reference. The user just used nail polish remover. While it is not super harmful, the smell is strong so the user can decide to open a window for rapid decrease. Or, since the user knows that the nail polish remover is causing it and it is not super harmful, the user can decide to let it go, and watch the curve slowly slow down to sync with the reference. No need to maintain a red flag or scary big number on the screen.
I also wanted to save the data on the cloud in order to be able to visualize them later on. For this purpose, I chose ThingSpeak, which is a IoT analytics platform service that allows me to send data to the cloud using http requests and visualize them easily. The free license allows you to send up to 3 million messages per year (~8, 200/day) and the minimum update frequency is 15 seconds.
As an embedded software engineer, I wanted to experiment with interfacing digital art, sensors and cloud visualization.
System overview- Launch the application via the touchscreen
- Touch the screen to exit the application
In the video above, VOC, PM2.5 and temperature curves are in sync with the reference curve: it means the values are good. Humidity curve is much smoother, it means humidity is low: I need to turn on my humidifier.
When I expose the sensor to nail polish remover, the VOC concentration is higher. It is shown by the VOC frequency going higher.
When I remove the VOC source, VOC levels go back to normal so the VOC curve sync again with the reference curve.
The Raspberry Pi has been connected to the WIFI beforehand. Also, to code my application, I used a headless setup via SSH and the RealVNC Viewer.
The live data can be visualized on ThingSpeak as shown below.
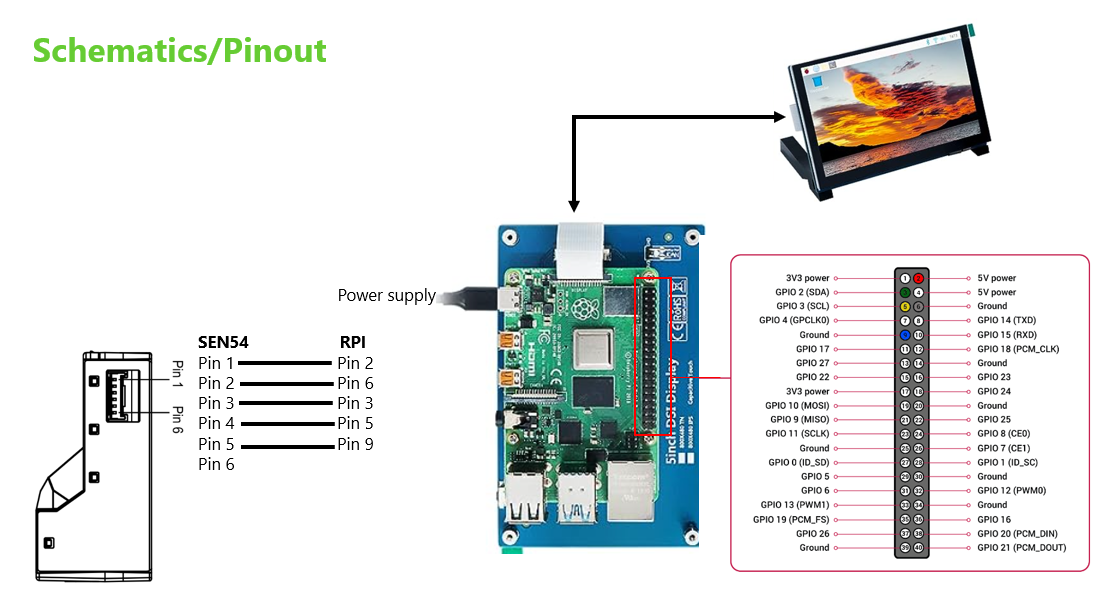
For this project, I used the SEN54 sensor from Sensirion. It is an all-in-one module allowing to monitor temperature, humidity, PM and VOCs. It communicates with the Raspberry Pi via I2C.
To configure the periods of the curves I searched the reference values of each factor. I used the following:
- Recommended indoor temperature: 20-25C or 68F-76F
- Recommended indoor humidity: 40-50%RH (Humidity levels are safe up to 60% but to discourage the growth and spread of mold, it is kept below 50%.)
- Recommended VOC index according to Sensirion: <150 (Sensirion VOC index range from 0 to 500 and detects the variation of the VOC concentration)
- Recommended PM2.5 levels: the US National Ambient Quality Air standard for a 24h average is 35ug/m3. To be safe, the limit in my code is 35ug/m3.
When the value is outside the recommended ranges above, either higher or lower, the period is proportional to how far from the reference the actual value is. If the curve is almost a flat line, it means that it is close to the minimum value, while if the curve's humps are really close to each other it means that the value is closer to its maximum.
Software breakdownThe I2C library to communicate with the sensor can be found in the SEN5X_I2C.pde file. I used the I2C processing library as well as the interface description of the commands in the SEN54 datasheet. You can find a snippet of it below. The code is very similar to the Arduino code.
import processing.io.*;
I2C i2c;

final byte SEN5X_ADDRESS = 0x69; //I2C address of the SEN5X

void I2C_init(){
  i2c = new I2C(I2C.list()[0]);
}

void startMeasurement(){
  i2c.beginTransmission(SEN5X_ADDRESS);
  i2c.write(0x00);    //I2C command according to the SEN5X datasheet
  i2c.write(0x21);
  i2c.endTransmission();
  delay(50);
}
To create the curves, I based my code on the Sine wave example available in the Basics>Math folder of Processing examples. All functions related to the visual is placed in the Visual_SineWave.pde file.
The workflow of the infinite loop is:
- Compute the curves positions
- If 2 seconds has passed since the last measurement, fetch the values from the sensor
- If the period is stable, check if the values are outside the reference values range. If it is the case, compute the new target period for this value.
- Check if the period needs to be increased, decreased or should stay the same.
- Add 1, -1 or 0 to each period depending on last step result
- Render the curves on the display
The main script is in the SineWave_SEN.pde file. In the setup function, I initialize the display window, the I2C communication and the sensor. Each time the function draw is called, a new frame is computed.
void setup() {
  //Window initialization
  fullScreen();
  noCursor();
  init_visual();

  //I2C initialization
  I2C_init();

  //Sensor initialization
  reset();
  startMeasurement();

}

void draw() {
  background(0);
  textDisplay();
  calcWaves();
  renderWaves();
}
For the cloud visualization, I just needed to implement a POST request via HTTP to log the data in the ThingSpeak server. I only push data every 10 seconds since it is the maximum frequency authorized for the free license version. Each field correspond to 1 sensor value and the values can be monitored live on ThingSpeak.
void httpPostThingspeak(float VOC, float PM, float humidity, float temperature) {
  PostRequest post = new PostRequest("http://api.thingspeak.com/update");
  post.addData("api_key", apiKey);    //your channel private key
  post.addData("field1", str(temperature));
  post.addData("field2", str(humidity));
  post.addData("field3", str(PM));
  post.addData("field4", str(VOC));
  post.send();
}I wanted to design a case to encapsulate all the hardware. In addition, there are some design considerations needed for the sensor such as isolating the inlet and the outlet to optimize the readings. Those guidelines can be found in the following application note: mechanical_design_assembly_guidelines. To design the enclosure, I used Fusion 360 by Autodesk. I didn't have the time yet, but I will print the parts using a Makerbot Replicator+ 3D printer.
Sensirion has a very convenient mechanical design case for the sensor available directly on their website. In addition to this sensor case, I created a box to fit the screen, the Raspberry Pi and the sensor. For easier installation, I created a back with snap-fit features. All the.step files can be found in the attachments.
SEN54 Sensor product page including the datasheet
SEN54 Arduino snippet code I used to build my library
I2C library for Processing to use the Raspberry Pi I2C interface
Sine Wave Example for Processing I used to start off my project
HTTP requests documentation for ThingSpeak
HTTP for Processing library used
Interesting links about IAQ factors


_t9PF3orMPd.png?auto=compress%2Cformat&w=40&h=40&fit=fillmax&bg=fff&dpr=2)


_3u05Tpwasz.png?auto=compress%2Cformat&w=40&h=40&fit=fillmax&bg=fff&dpr=2)

Comments
Please log in or sign up to comment.