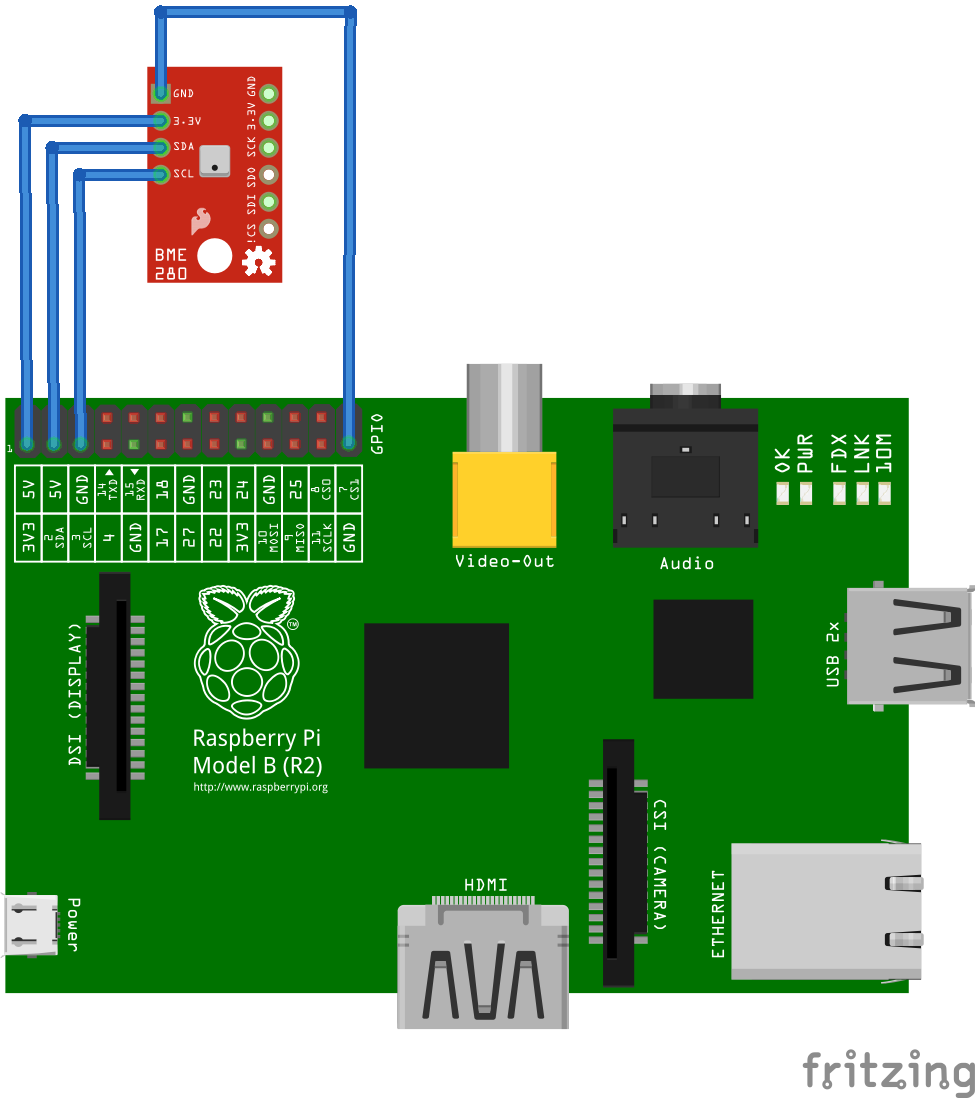
To connecting the BME280 sensor (I2C device) directly to the Pi you only need four wires. See diagram bellow:
I used BME280 Sensor Driver to read the temperature, humidity and pressure from BME280 sensor. I recommend you to follow the official driver instruction. If you have I2C kernel driver enabled in your Pi the sensor data reading is easy:
Tool i2cdetect was used to get sensor address 0x76:
pi@raspberrypi ~ $ i2cdetect -y 1
    0  1  2  3  4  5  6  7  8  9  a  b  c  d  e  f
00:          -- -- -- -- -- -- -- -- -- -- -- -- --
10: -- -- -- -- -- -- -- -- -- -- -- -- -- -- -- --
20: -- -- -- -- -- -- -- -- -- -- -- -- -- -- -- --
30: -- -- -- -- -- -- -- -- -- -- -- -- -- -- -- --
40: -- -- -- -- -- -- -- -- -- -- -- -- -- -- -- --
50: -- -- -- -- -- -- -- -- -- -- -- -- -- -- -- --
60: -- -- -- -- -- -- -- -- -- -- -- -- -- -- -- --
70: -- -- -- -- -- -- 76 --
After HW connecting and I2C configuration RPi.bme280 package was installed:
sudo pip3 install RPi.bme280
Now we are ready for reading data:
#!python
import smbus2
import bme280
port = 1
address = 0x76
bus = smbus2.SMBus(port)
bme280.load_calibration_params(bus, address)
data = bme280.sample(bus, address)
print(data)
Output:
compensated_reading(id=251d4633-bbb1-46d9-b252-5fa50a2d1dc1, timestamp=2017-05-31 20:28:41.007829, temp=24.499 °C, pressure=994.76 hPa, humidity=54.57 % rH)
We have successfully connected the BME280 sensor to the Pi and we are able to read data from it. It was pretty easy. Isn't it? You can find on the internet many similar tutorials how to connect different sensors to the Pi. Many of them use as visualization just static picture or e.g. JavaScript based dygraphs or e.g. cloud based thingspeak. My goal is to have real-time monitoring with history accessed from anywhere. I would like to have private dashboard that I can share with my friends and I do not want pay more than 5€/month. I spent many hours by finding optimal solution and I realized that only time-series database can properly solve this use-case. And I decided for the best one InfluxdDB. As visualization tool I used Grafana - the same tool that SpaceX company uses.
Generally you have two options:
- Buy public IP address and install/configure InfluxDB and Grafana on your own (Pi) server
- Buy virtual machine and install/configure Grafana and InfluxDB.
Both options are expensive, performance is not good and proper secure configuration is not easy. Last month I found out new start-up Corlysis that solve this issues. It is affordable InfluxDB and Grafana hosting for your cool projects.
Sending sensor data to the time-series databaseFirst of all create Corlysis account and by one click create new InfluxDB database.
Connect to your Pi and clone GitHub repository:
git clone https://github.com/corlysis/scripts.git
And after that go to the Corlysis app and click to your database to see password and database name. Use those info as parameters to bme280_sensor.py script:
cd scripts
python3 bme280_sensor.py demo 4e2ddUU36d78e2967a3wds54c
And that is all. Right now you are sending data from your sensor to the time-series database InfluxDB by HTTPS POST. You can also easily update this script for different sensors.
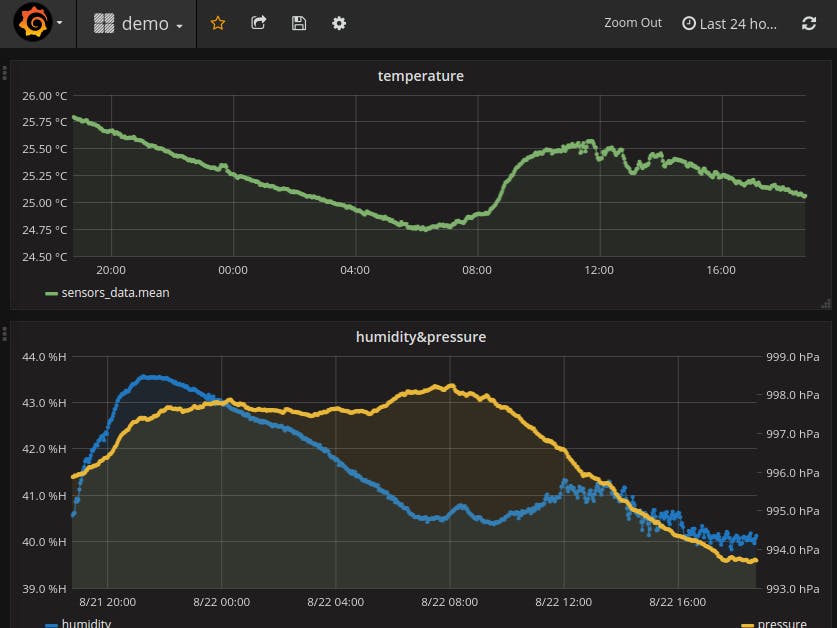
Visualize sensor dataWe have sensor data in our database and every 10 seconds new ones are coming. Go to the Corlysis app and click to the Grafana in the top menu. Your database is pre-configured as the data source so you just click to create new dashboard and new graph and select your measurement and field name to see e.g. temperature graph. I recommend to you to see this video:
And that is all. So you can enjoy your amazing interactive graphs from anywhere.


_3u05Tpwasz.png?auto=compress%2Cformat&w=40&h=40&fit=fillmax&bg=fff&dpr=2)


Comments
Please log in or sign up to comment.