


Hardware components | ||||||
_ztBMuBhMHo.jpg?auto=compress%2Cformat&w=48&h=48&fit=fill&bg=ffffff) |
| × | 1 | |||
| × | 1 | ||||
A useful tool to visualize at real time data of the MPU9250 sent through a COM port, using PyQtgraph and PyQt5.
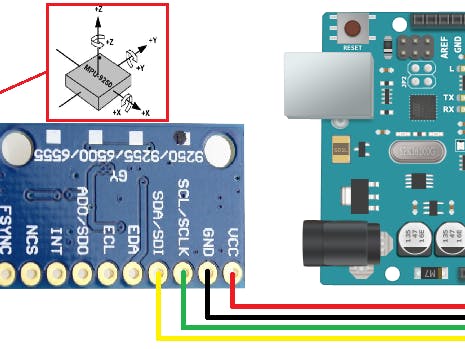
The MPU-9250 is a sensor from Invensense Inc. that combine in one package both accelerometer, gyroscope and magnetometer. It embeds also a thermometer and other useful things. The datasheet can be found here.
Repository Contents- /Libraries — An Arduino library from sparkfun
- /acq_mpu9250 — The Arduino code to send data to a COM port
- mpuScrollingPlot.py — A Python script for "scrolling plotting"
- mpuPlotSavedData.py — to visualize saved data
- Import serial
- Import time
- Import numpy as np
- From matplotlib import pyplot as plt
- Import pyqtgraph as pg
- From pyqtgraph.Qt import QtCore, QtGui
- Import os
- Import pyqtgraph.console
- Import PyQt5
I use an Arduino board. Here is how I do it:
Here is the interface. It allows you to visualize data. You can also save the data between cursors and plot them later.
The script mpuPlotSavedData.py allows you to plot the saved data using matplotlib.


Comments
Please log in or sign up to comment.