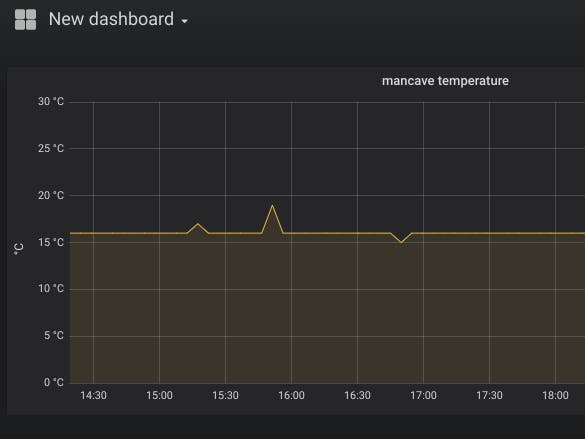
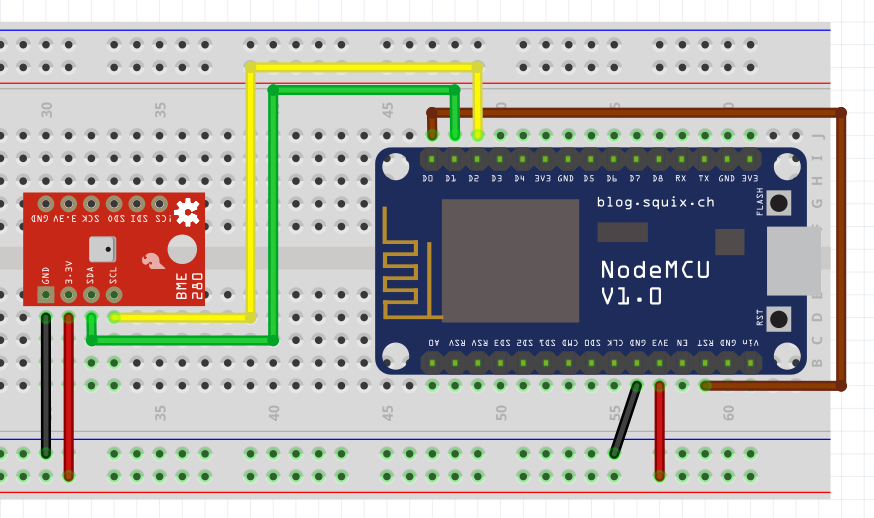
I have no smart home, but I wanted to have some statistics about temperatures / humidity in several rooms in our house. So I started to place some NodeMCU with BME280 and installed monitoring with MQTT, InfluxDB, Telegraf and Grafana on a Raspberry Pi 3B+. In my opinion the best part is: You don't need any internet-services, your data stays at home...
What steps do we need- installing mosquitto (mqtt)
- installing InfluxDB
- installing telegraf
- installing grafana
- prepare NodeMCU with micropython
- customize boot.py
- upload boot.py to NodeMCU
- create Dashboards in Grafana
Very simple, just type:
sudo apt install mosquitto mosquitto-clients
The mqtt-daemon starts automagically.
curl -sL https://repos.influxdata.com/influxdb.key | sudo apt-key add -
echo "deb https://repos.influxdata.com/debian stretch stable" | sudo tee /etc/apt/sources.list.d/influxdb.list
sudo apt update
sudo apt install influxdb telegraf
sudo systemctl enable influxdb
sudo systemctl start influxdb
influx
CREATE USER admin WITH PASSWORD 'password' WITH ALL PRIVILEGES
CREATE DATABASE telegraf
CREATE DATABASE rooms
Edit the influxdb configuration file
sudo nano /etc/influxdb/influxdb.conf
Delete the "#" before
[http]
 # Determines whether HTTP endpoint is enabled.
  enabled = true
 # The bind address used by the HTTP service.
  bind-address = ":8086"
 # Determines whether user authentication is enabled over HTTP/HTTPS.
  auth-enabled = true
after that you have to restart the service:
sudo systemctl restart influxdb
Edit Telegraf configuration file:
sudo nano /etc/telegraf/telegraf.conf
omit_hostname = true
[[outputs.influxdb]]
 ## The target database for metrics; will be created as needed.
  database = "telegraf"
# we create a seperate database for our measurements, so we don't want the
#  data in the telegraf-database
  namedrop = ["sensors*"]
 ## HTTP Basic Auth
  username = "admin"
  password = "password"
Now the configuration file for our data:
sudo nano /etc/telegraf/telegraf.d/sensors.conf
# Input data as json-String
[[inputs.mqtt_consumer]]
 servers = ["tcp://localhost:1883"]
 topics = [
   "sensors/#",
 ]
 client_id = "telegraf"
 data_format = "json"
 name_prefix = "sensors_"
 json_name_key = "location"
 tag_keys = ["temperature","humidity"]
 json_string_fields = ["location"]
# Output for influxdb
[[outputs.influxdb]]
 urls = ["http://127.0.0.1:8086"]
 username = "admin"
 password = "password"
 database = "rooms"
 namepass = ["sensors*"]
Check if there is a newer version: Download Grafana
 wget https://dl.grafana.com/oss/release/grafana_5.4.1_armhf.deb
sudo dpkg -i grafana_5.4.1_armhf.deb
Download the firmware binary for ESP8266: esp8266-20180511-v1.9.4.bin
Deploy the firmware as described here.
Install ampy as described here.
Upload boot.py to your NodeMCU with ampy:
ampy -p ttyUSB0 -b 115200 put boot.py
After that you should reset your NodeMCU that it can start sending measurements to your database.
Make your first Grafana-dashboard as described here.


Comments