

Software apps and online services | ||||||
 |
| |||||
In this post I'm going to present you how to setup the code to run the final product.As you can see on my Github Page the entire project is divided into two main topics:
- Virtual Sensors
- Web Application
In virtual-sensors/ folder you can find some python scripts that simulate two different environmental station sending data about weather conditions.
In web_view/ there's the web application useful to monitor the environmental station data.
Well, clone or download the repository and let's start!
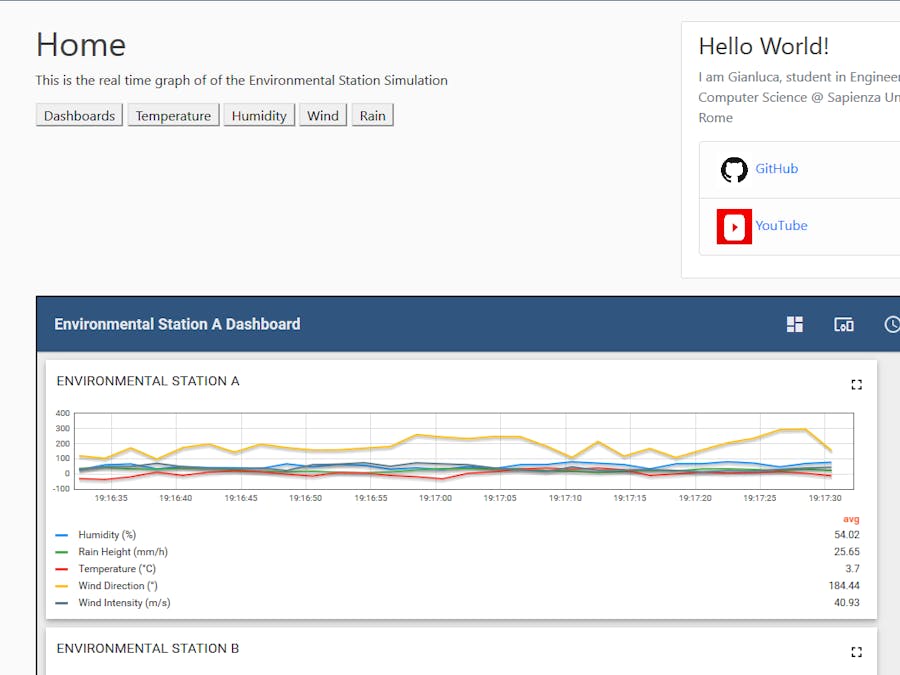
How it worksThe system communicates via MQTT protocol with Thingsboard, an online platform that act as MQTT broker and lets the final user to see the registered data though simple dashboards.
Once the Environmental Stations Simulation is running it sends random generated data in json format to Thingsboard that elaborates them and displays them in dedicated dashboards that can be viewed by the final user.
To make the project correctly work some things are required.
- paho-mqtt needed for the MQTT communication for the python scripts with the broker.
- django to run the web application.
- Thingsboard account for the dashboards views.
The entire project has been developed and tested on GNU/Linux and it's not supposed to work out of the box for Windows or Mac OS.
Thingsboard and the CodeTo obtain access to the MQTT broker and to te dashboard functionalities you have to register an account to the Thingsboard Demo platform.
Once registered to the service you will have access to the user tenant panel. Click on the DEVICES section and then add a new device by clicking on the red button in the down right side of the screen. In my case I have added two devices named Environmental Station A and Environmental Station B.
Now it's time to get the device's access token to set up the paho communication client on the python Virtual Environmental Station: to do this click on the shield icon of the device and copy the access token as shown in the picture.
Then open the Simulation.py script in the folder virtual-sensors/ and change the values of the variables with your device's values as shown in figure.
To enjoy the data stream you have to create the dashboards of the device.Start sending the data by running the Simulation.py script on your local machine.Then go to DEVICES, click on your device's card and then go in the TELEMETRY spot: if you have run the script you should see the telemetry values. Select all and then click on SHOW ON WIDGET > select CHARTS from Current bundle and then ADD TO DASHBOARD by creating a new one.
Do not forget to make your dashboard public!
Prepare the web app!If you want to include your dashboards in your web application you can simply use this web app and change some stuffs.First make your dashobard public and copy the public link.In your DASHBOARDS panel click on the pencil icon of your dashboard's card and copy the public link.
Now replace my link with yours in the iframe tag in the web_view/web_view/templates/web_view/home.html file.
Sensors are simply objects that, when requested, produce a random value in the established ranges and ad payoload, that is a string.
Sensors are part of Environmental Station objects that take the payload of each sensor, transform it into a proper json string and then send it to the broker at the selected topic.
If you're running the application on your local machine go in web_view/web_view/ and in the settings.py file change swap the comment at the DEBUG variables.
Now go in web_app/and run
python manage.py runserverAnd in virtual-sensors/ run
python Simulation.pyOpen the web app at localhost:8000 and you should see the data flow!
Pssssst, a secret: if you just want to see the data flow clone my repository and simply run the Simulation.py script, then connect to iotwebapp.herokuapp.com and enjoy!
YouTube link


Comments
Please log in or sign up to comment.