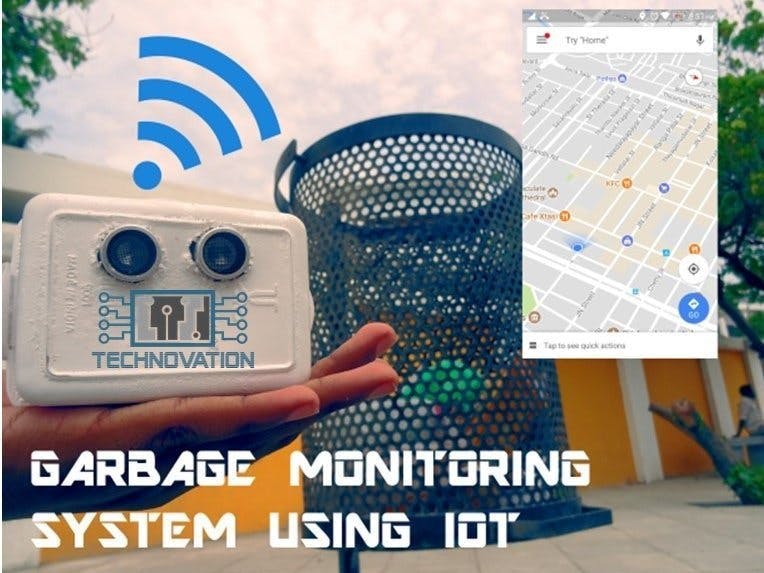
One of the main concerns with our environment has been solid waste management which impacts the health and environment of our society. The detection, monitoring and management of wastes is one of the primary problems of the present era. The traditional way of manually monitoring the wastes in waste bins is a cumbersome process and utilizes more human effort, time and cost which can easily be avoided with our present technologies.
This is our solution, a method in which waste management is automated. This is our IoT Garbage Monitoring system, an innovative way that will help to keep the cities clean and healthy.Follow on to see how you could make an impact to help clean your community, home or even surroundings, taking us a step closer to a better way of living : )
Overview of the Monitoring SystemObserved that the garbage truck use to go around the town to collect solid waste twice a day. Although this system was thorough it was very inefficient. For example let's say street A is a busy street and we see that the garbage fills up really fast whereas maybe street B even after two days the bin isn't even half full. This example is something that actually happens thus it lead us to the ''Eureka'' moment!
What our system does is it gives a real time indicator of the garbage level in a trashcan at any given time. Using that data we can then optimize waste collection routes and ultimately reduce fuel consumption. It allows trash collectors to plan their daily/weekly pick up schedule.
The basic model works like this: To start with, you will first have to enter the height of the dustbin. This will help us generate the percentage of trash in the trashcan. We then have two criterias which needs to be satisfied to show that the particular bin needs to be emptied :
- The amount of trash, in other words let's say if your bin is half full you don't really need to empty it. Our thresh, or maximum amount that we permit of trash, is 75% of the bin. (You could alter the thresh according to your preference.)
- If supposing a particular trashcan fills up 20% and then for a week doesn't change, it comes into our second criteria, time. With time even the little amount will start rotting leading to a smelly surrounding. To avoid that our tolerance level is 2 days, so if a trashcan is less than 75% but it is two days old it then will also need to be emptied.
After making your connections, go to thingsio.ai cloud platform, for those who don't know about this platform can follow the following steps to register and create new project and visualize the data.
Setting UpCloud Account on ThingsIO.AI
ThingsIO.AI is a IoT platform for developers. As a developer we understood the pain of not having a seamless place to connect, analyze and process device data. Many pure analytics platforms does not offer device management, which is core for the iot. That is the reason for ThingsIO.AI.
- Register the account in http://thingsai.io/
- You will get the notification for sign up.
- Go in your email address and verify your account.
- After that, sign in your account with your email address and password
- Now, you will be on the project dashboard. Click on the new project option.
- Click on the add a new device option. you will get device ID.
- Enter the device name and click on the create and configure device.
- You will be on your device dashboard.
Some Basic Points(1-5) for Analysing Data on ThingsIO.AI.
1. Track your device’s special parameters here. This can be set in device configuration(default to null).
2. You can see your real time and special parameter’s graph.
3. You can see your all data points.
4. You can see here your last 5 data points.
5. You can see here all the list of created graphs.
- Go in sample device code options and click on the NodeMCU.
- You will get the sample code from there copy and paste into your Arduino IDE.
Click on the “Send trial data” to send a trial data to the server:
Charting and Visualizations on ThingsIO.AIGo to your ThingsIO.AI account and go to your device.
Click on the configuration device option:
- You can set the special parameters (this is tracked on the device dashboard) & transform it accordingly and add new parameters (Parameters are updated automatically as you send them from your device).
- Click on the update device option:
- To create a graph for your device click on the “create graph option."
- Put the parameter that you want in your graph.
- And you will be having the graph of your data.
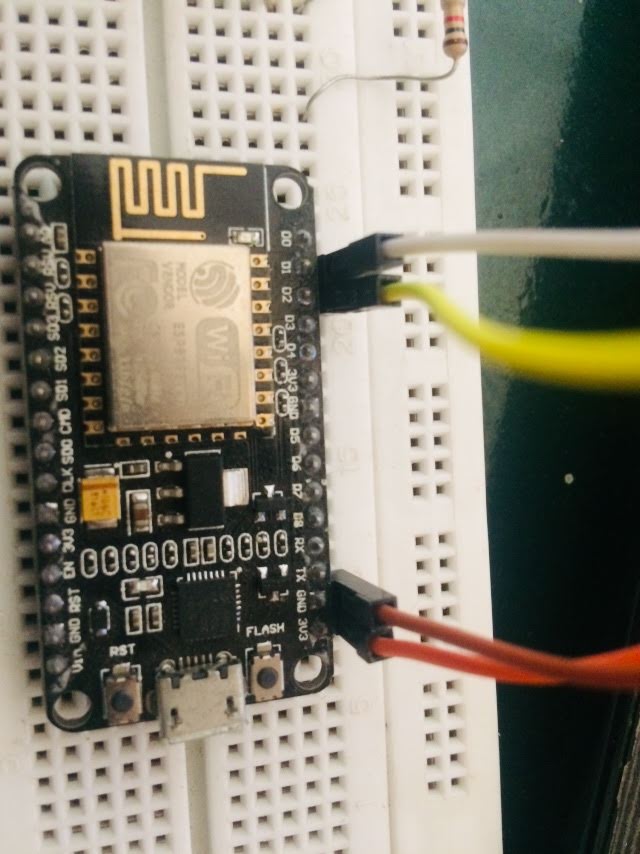
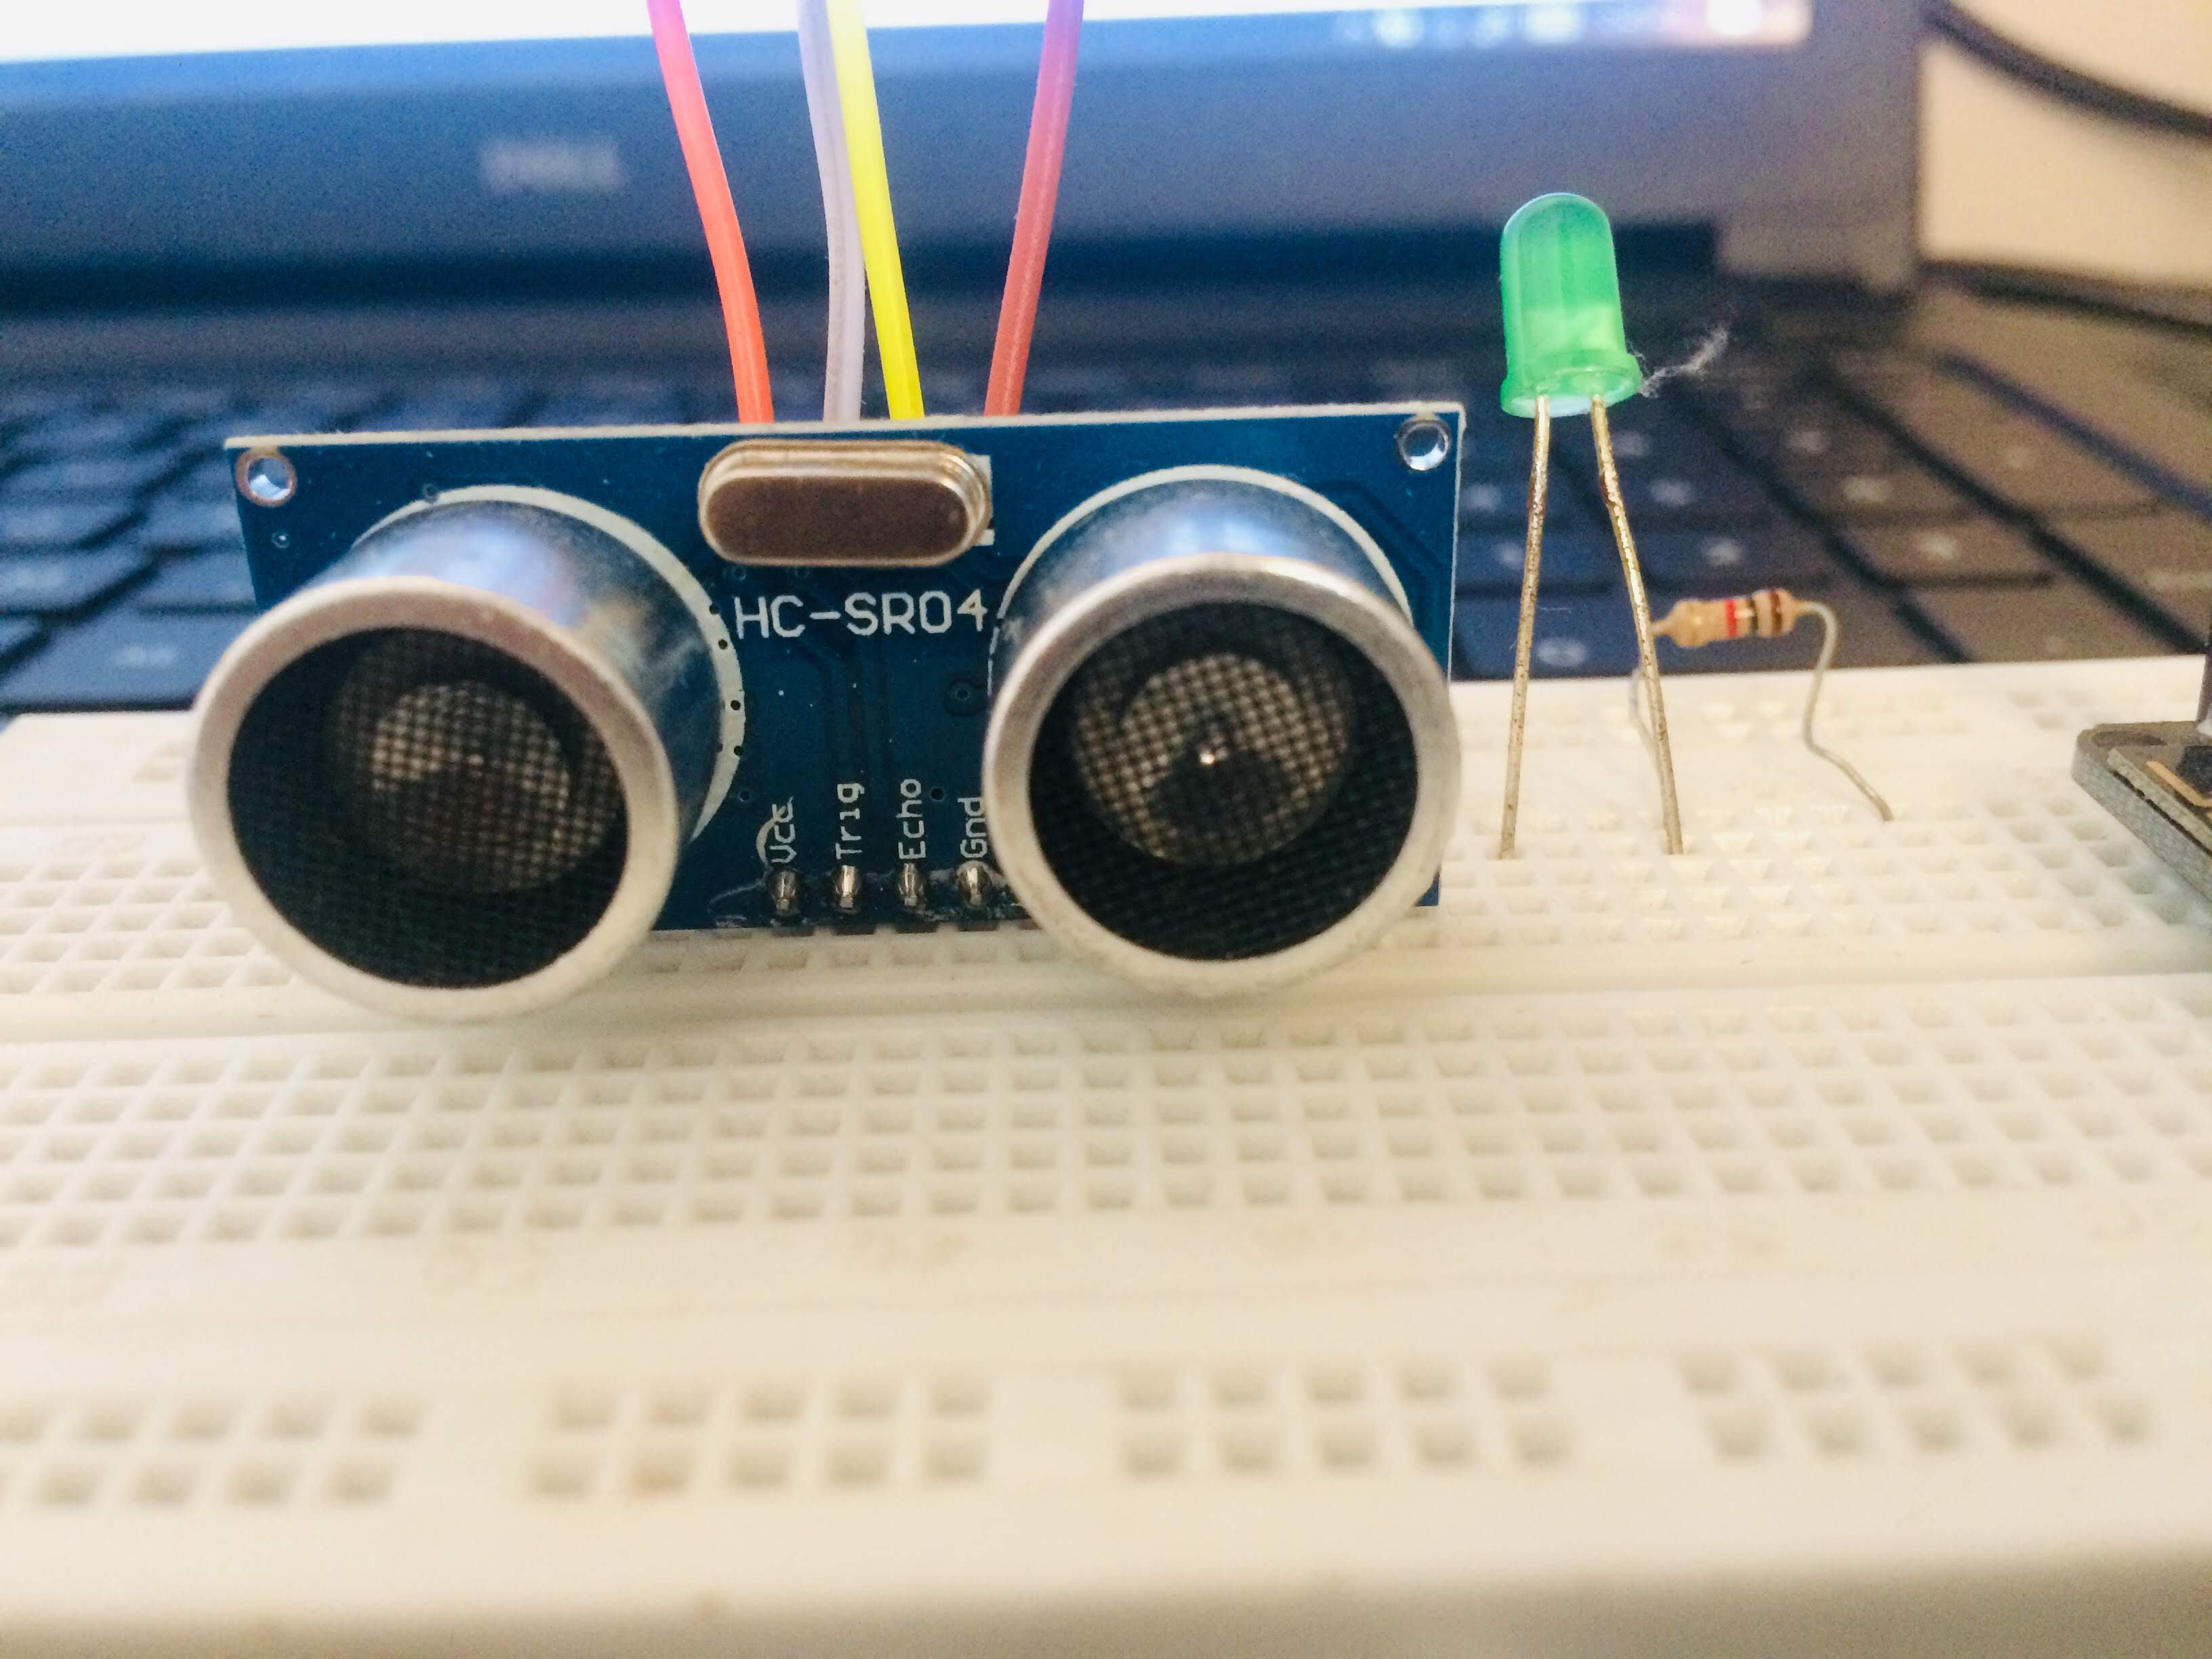
After making the proper connections, dump your program to nodemcu and then see if you are getting the correct output I your serial monitor or on Thingsio.ai. complete illustration of the same you can see in below video.
Any questions or suggestions, please let me know:)


_wWOrJJ7y67.JPG?auto=compress%2Cformat&w=40&h=40&fit=min&dpr=2)


_wWOrJJ7y67.JPG?auto=compress%2Cformat&w=60&h=60&fit=min&dpr=2)


Comments
Please log in or sign up to comment.