This is a three part article.
- In part 1 we show how to read data from a sensor and plot the data in real-time.
- In part 2 we send the data over wifi using MQTT.
- In part 3 we persist the data in a database and plot data on browser accessible dashboard.
You might well wonder why write this article, since there are hundreds of articles showing this basic process? Well the purpose is to demonstrate a begginer friendly workflow that is not too complicated using CircuitPython, and demonstrates a solution that has real world applications - logging sensor data over a network, storing it in a database and displaying the data on a dasboard is what many IoT companies are doing (note, we are skipping security which is what you pay the companies for, as well as scale).
We require:
- Basic knowledge of Python
- A text editor or IDE
- Open source software that doesn't require internet connection, maintaining privacy and keeping life simple
Ok, lets get started!
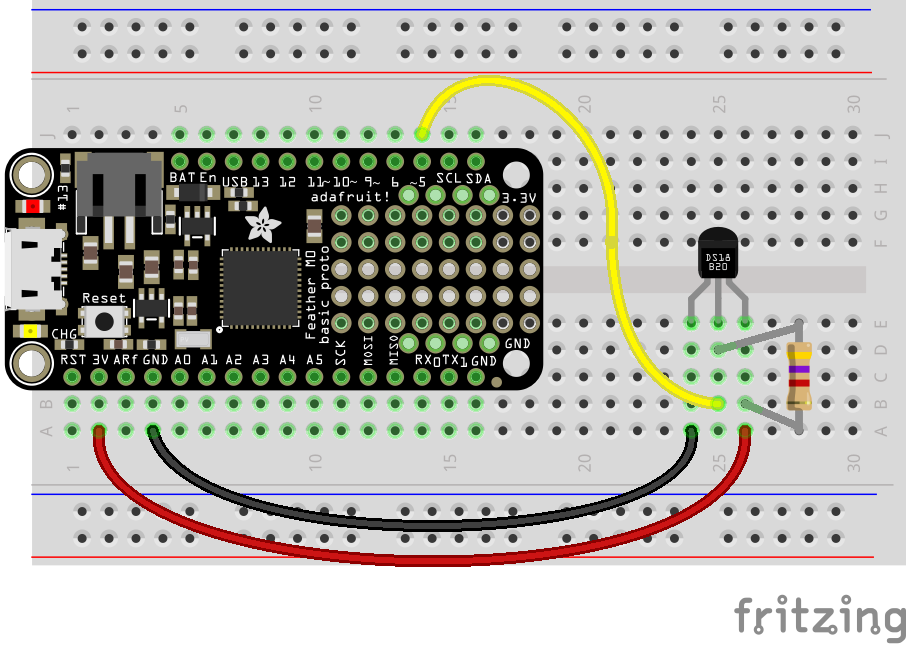
Part 1: Reading data and live plottingIn part 1 we demonstrate the basic functionality of reading and visualising sensor data using a CircuitPython board. I am using a basic temperature sensor, the DS18B20. Adafruit have published a very thorough article where they walk through wiring up the sensor to a CircuitPython board, so I recommend you read that article if you want more detail than I provide here. The wiring diagram is at the end of the article, and the important thing is to make sure you use the pull-up resistor - the docs recommend a 4.7 k resistor but I am using 10 k with no issue. Below is a photo of my wired system, connected via USB to my laptop:
The Python code required to read the sensor data and print it to the console is below:
import board
import time
from adafruit_onewire.bus import OneWireBus
from adafruit_ds18x20 import DS18X20

# Initialize one-wire bus on board pin D5.
ow_bus = OneWireBus(board.D5)
ds18 = DS18X20(ow_bus, ow_bus.scan()[0])

while True:
    print((ds18.temperature,))
    time.sleep(1)
With just a few lines of Python, we are reading the temperature sensor every second and logging the data to the console of the connected laptop. This code should be entered in the code.py file on the CircuitPython board - this is the file that is run each time the board is powered on. One fantastic feature of CircuitPython boards is that when connected to your laptop via USB, they show up as an external drive. You can then use any text editor to edit the Python files, and on saving changes to the file the code is automatically re-run. This makes for very fast development of the code, in contrast to Arduino type boards where you program in C, compile and upload changes. Another great feature of CircuitPython is that you can connect to the Read-Evaluate-Print-Loop, or REPL, and directly interact with the the board. This is very handy when you want to prototype or debug code.
As mentioned you can edit the Python file with any text editor or IDE. For example in my day job I typically use VScode, and this is perfectly fine for use with CircuitPython projects. However, even if you are an experienced developer I recommend you try out the Mu editor, which provides a very streamlined UI for working with CircuitPython, and also makes it simple to plot data in real time - just put your printed values in parenthesis (like this, ). Plotting sensor data using Mu is shown below:
This concludes part 1, demonstrating reading and plotting the sensor data on a connected laptop. Let us call this level of achievement level zero - we have demonstrated a minimum-viable-product (MVP). In part 2 we will send data over WiFi and breaking the USB shackles connecting our CircuitPython board to our laptop!
Part 2: Sending data over WiFi, logging and plottingIn part 1 we demonstrated reading and plotting the sensor data, but we were required to physically connect the CircuitPython board to our laptop via USB cable. This is a significant limitation for projects, as we don't want to dedicate a laptop to each CircuitPython board just to plot the data! There are many projects that demonstrate using some kind of LCD display to show the data, but then the data is still confined to the board. What we really want is to send the data over a network, so it is available on another computer where it can be processed and visualised. My personal preference is to use WiFi to send data over a network - this is a power hungry option but WiFi is nearly always available, has good range, and does not constrain your bandwidth that much. Clearly however this will require us to use a CircuitPython board with WiFi capabaility, and I am using the Metro M4 Airlift (WiFi), shown below:
To actually send the data over the WiFi network there are a number of approaches we could use, but a very common approach in IOT is to use MQTT. With MQTT we are sending ('publishing') messages of data to a message broker, and other services can subscribe to these messages. A 'topic' is used to identify streams of associated messages. It is not actually necessary to setup ('host') your own MQTT broker, and Adafruit provide a free to use broker and have great documentation describing how you can visualise data sent to their broker. If you do want to setup your own broker this is quite straightforward, and I recommend using the Mosquitto broker. This can be run on most laptops, and even a Raspberry pi. This article assumes you are running your own broker, and in particular we are not going into any details about how you would secure an MQTT broker or encrypt your MQTT data - both of which you would definitely want to do in any commercial project or if you are on an unsecured network.
The code required to publish the sensor data is over MQTT is in the code.py file at the end of this article. Additionally two small files are also required, the first is secrets.py, and the second is config.py. The secrets file contains your WiFi and MQTT broker crendentials, and these should be entered once. The config file contains variables used by code.py, and you might want to experiment with these. With this code running you will see the sensor data printed on the console as before, but it is now also being published over MQTT. There are a range of open source apps for viewing MQTT data but I recommend MQTT Explorer which will automaticlally plot numerical data, shown below. The sensor readings are published on the m4-temperature topic and graphed in real time, very cool!
In this final part of the article we are going to graduate to level Hero by persisting the data in a database, which means we have a historical record of the data for analysis and visualisation. Now we are in the software world there are any number of ways to achieve this. If you are confident with python you could write your own scripts to capture the MQTT data and persist it to any kind of database you want using the excellent paho-mqtt library. Alternatively there are a number of software 'connectors' which can be used to automalically capture MQTT data and 'ingest' it into other software (including databases), for example InfluxDB or Kafka. However in this article we are going to keep it simple, local and open source, and use Home Assistant to persist and visualise our data.
Home Assistant is open source software written in python that allows you to automate your home, and persist data to a database (sqlite by default). It can be run on a Raspberry Pi or your laptop, and has excellent support for MQTT. There is an ecosystem of addons for Home Assistant if you are using their recommended Hass.io installer, and this includes addons that provide an MQTT broker, and integration with databases incuding InfluxDB (a NoSQL database) and MariaDB (a SQL database). Home Assistant itself provides basic plotting and graphing via its UI, but if you want to get more fancy its pretty straightforward to plot data using Grafana. I will not go into the details of setting any of this up as that is covered in the Home Assistant docs, but will assume you are running Home Assistant and have it connected to your MQTT broker. In Home Assistant you should add an MQTT sensor which will capture your MQTT data from the temperature sensor. The Home Assistant configuration (YAML) for this is below:
- platform: mqtt
  name: m4-temperature
  state_topic: m4-temperature
  unit_of_measurement: '°C'
With this configured, you will now be persisting the data to your chosen database backend, and can now view the sensor readings on the Home Assistant UI, shown below:
Now that this data source is added to Home Assistant you can use it to automate actions in your house, for example to turn on a desk fan if the temperature is too high.
If you are interested in analysing your sensor data using Python, I recommend you checkout the Jupyterlab Hass.io addon, which provides an IDE specifically for doing data analysis with Python. This addon includes a python package that makes it very straightforward to read data from your database, as well as functions to plot your data. Check out the Data Science pages on the Home Assistant website to get started!
SummaryIn this article we started by demonstrating reading sensor data in only a few lines or Python, following a simple workflow. We then progressed from zero to hero to show how you can send data over a network using MQTT, liberating your data and persisting it to a database for long term storage and visualisation. I hope this inspires you to get started with hardware if you are a software person, and encourages you to get started with data visualisation if you are a hardware person. It would be great to hear what projects people get up to following the process presented in this article, and please feel free to post info on your projects in the comments below. Thanks for reading!


_1x_bGT19vVAby.png?auto=compress%2Cformat&w=40&h=40&fit=fillmax&bg=fff&dpr=2)


Comments