


Hardware components | ||||||
| × | 1 | ||||
| × | 1 | ||||
| × | 1 | ||||
| × | 1 | ||||
| × | 1 | ||||
| × | 1 | ||||
 |
| × | 3 | |||
 |
| × | 4 | |||
Software apps and online services | ||||||
 |
| |||||
| ||||||
| ||||||
| ||||||
| ||||||
Hand tools and fabrication machines | ||||||
 |
| |||||
As fans of CAD and 3D models we use our FDM (filament) and SLA (resin) printers a lot. But while they permit us to make our imagination real they are also a harmful source of toxic gas.
That’s why when using 3D printers, especially SLA, we wear PPE (personal protective equipment) and avoid staying in the room for too long.
A room with 3D printers needs proper ventilation so you can continue your hobby without putting your health to risk!
But how do we know when we can enter the room and when to air it out?
Objectives of the projectOur objectives were to create a small device that allows us to monitor the indoor air quality (IAQ).
This one should be able to give us alerts about the IAQ and other useful information about the environment for optimal printing conditions.
Why do we use LoRa?LoRa allows us to put the device anywhere under a LoRaWAN gateway coverage. This way the device doesn’t need to be connected to the local network to work as intended.
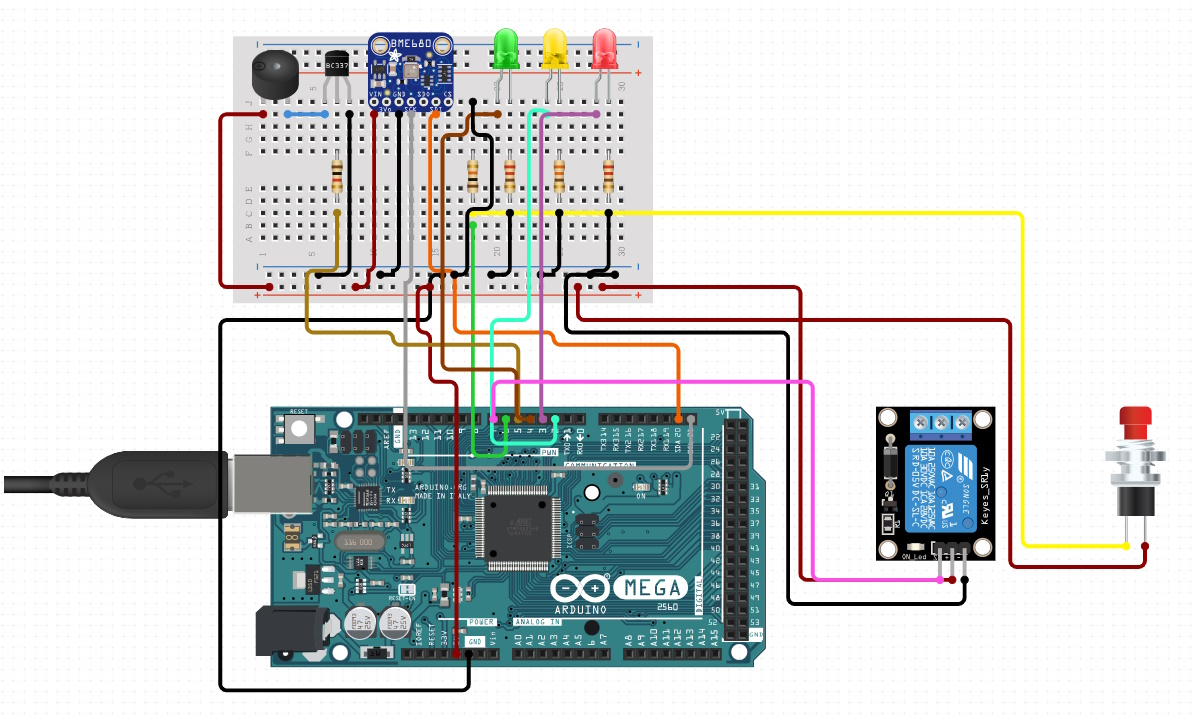
First stepsFirst we had to find which elements we needed to monitor.
After some research we chose to get a VOC (Volatile organic compounds) sensor. It came with temperature, humidity and pressure sensors.
As this device could be used for more than just 3D printers we chose to implement a PM (Particulate Matter) sensor.
A relay was needed to control ventilation with for example a fan.
With that we had to communicate with the user. We used 3 LEDs and a buzzer. The LEDs show the IAQ and the buzzer can be toggled to warn anyone of poor IAQ. LEDs are also useful to signal a message being sent.
We used a button to help us debug and kept it to let the user force an uplink.
The Arduino ProgramThe Arduino programme is divided into 7 distinct sections :
- Librairies import
- Defines (LoRa card, pins used, PM sensor)
- Setup (pinModes, LoRa init, buzzer/LEDs test, BME init)
- Loop (check for sudden IAQ changes, periodic downlink, check for uplink, update LEDs states)
- Receive message (loop to read every character received)
- Send message (readings of data inserted into the payload buffer)
- Button interruption
On TTN website, we registered our object using the OTAA (Over The Air) activation method. We chose OTAA rather than ABP for better security, flexibility and scalability.
To link our device to this service, we used several addresses: the devEUI, the appEUI and the appKey. When it is connected to TTN, we can see the data contained in the payload. However, to understand more the values received, we used a custom JavaScript formatter. Each byte is labeled with the corresponding type of data (temperature, humidity, pressure and gas). Some values are greater than 255, in this case we encoded the data on 2 bytes in the Arduino code. To get the actual value, we used the following formatter:
function decodeUplink(input) {
   var pressure = (input.bytes[4] << 8) | input.bytes[5];
   return {
      data: {
         temperature: input.bytes[1],
         // ...
         pressure:pressure,
      },
   warnings: [],
   errors: []
   };
)
Regarding the VOC sensor, it returns values equivalent to kOhms so we divided it by 1000 to send the data using only one byte.
MQTTWe used the integrated MQTT offered by TTN. This way we developed a program written in Python to connect to the MQTT broker, subscribe and read the messages. Once we receive a message we clean the data only to keep the sensor information and send it to our database.
MongoDBWe create a database on MongoDB using a free cluster. Once the database has been created, we wrote a simple python script to insert data into it.
We can connect to the database using the MongoClient library with its link, the ID and the password created before on the MongoDB web platform.
def get_database():
    CONNECTION_STRING = "mongodb+srv://" + DB_id + ":" + DB_pwd + "@" + DB_link + "/?retryWrites=true&w=majority"
    client = MongoClient(CONNECTION_STRING)
    return client['printing_companion']
After that, we can insert the data using the following method:
def insert_data(dbname,data):
    dbname["REDACTED"].insert_one(data)
Telegram allowed us to send alerts to the user. To set up this we need first to create a bot through Telegram. For this you have to start a conversation with @BotFather.
Once your bot is created, store your token access and keep it private. Now to make your bot alive we will use a Python library called “telethon”. This way we can create events on new messages.
By convention we made a custom welcome message when the user send “/start” to his bot. It replies with “Welcome!” and a list of the other commands.
We created “/status” to get the last data received, “/alarm” and “/relay” to toggle them respectively.
Finally a function was needed for the bot to send messages:
async def send_message(message: str):
chat_id = 0123456789
await client.send_message(chat_id, message)
This way he sends them to a set channel.
Web ApplicationThe web application allows the user to see the latest data available and also get the history of the data for the current day or for personalized dates.
To develop it, we used the Dash library in python to build and launch the app. It is accessible by any device connected to the same local network than the device deploying the app using this command:
app.run(debug=True, host='0.0.0.0', port='4567')Here we accept all incoming connections from the local network, using the port of our choice such as 4567 for example. With this library, we can set up a basic authentication to access the dashboard using a pair of ID and password for each user.
After connecting to the database just as shown in the MongoDB part, we can retrieve all the data using the following method. Here we use the Panda library (named as pd) to convert the data received into a dataframe.
def query_data():
    dbname = get_database()
    collection_name = dbname["dht"]
    data = collection_name.find()
    dataFrame = pd.DataFrame(data)
    return dataFrame
Regarding the first window, we mainly used gauges to show the latest values available. Each gauge is contained in a line and a row of a table using the dash bootstrap components library. This type of graph is available using the dash_daq library. We used it just like this example:
daq.Gauge(
    id='latest-gas',
    color={"gradient":True,"ranges":{"#00FF00":[0,25],"#ADFF2F":[25,45],"#FFFF00":[45,65]," #FFA500":[65,85], "#FF0000":[85,98], "black":[98,100]}},
    showCurrentValue=True,
    units="",
    value=0,
    label="Gaz",
    max=100,
    min=0,
),
Regarding the second window, we used the plotly express library. It provides options to interactively select different time intervals (1 hour, 3 hours, 6 hours, 12 hours, or all) using a range selector tool. This visualization is useful for analyzing how the variables change over different time periods.
gas_figure_hour = px.line(dataFrame, x='received_at', y='gas', title='Gas')
gas_figure_hour.update_xaxes(
    title="Date et heure de réception",
    rangeslider_visible=True,
    rangeselector=dict(
        buttons=list([
            dict(count=1, label="1h", step="hour", stepmode="backward"),
            dict(count=3, label="3h", step="hour", stepmode="backward"),
            dict(count=6, label="6h", step="hour", stepmode="backward"),
            dict(count=12, label="12h", step="hour", stepmode="backward"),
            dict(step="all")
        ])
    )
)
About the third window, we used the Dash library to create a calendar using the DatePickerRange component and add graphs just like below.
dcc.Graph(
    id='gas-graph-date'
    figure={
        "data": [
        {
            "x": [],
            "y": [],
            "type": "lines",
        },
        ],
        "layout": {
            "title": "Gaz",
            "yaxis": {"title": "IAQ index"},
            "xaxis": {"title": "Date et heure de réception"}
        },
    },
    style={'width': '95vw'}
),
For the first window, the data is reloaded at every interval of 30 seconds. For the second window, we get the data every time the user clicks on the reload button. Regarding the last window, the data is retrieved every 30 seconds or when the user changes the dates. The interval is added using the Interval component of the Dash library.
When one of those events is triggered, the commands contained in the @app.callback() function are executed. Regarding the personalized dates, the data is filtered to include only rows where the 'received_at' column's datetime values fall within a specific range defined by the 'start_date' and 'end_date' variables:
dataFrameDate = dataFrame[(pd.to_datetime(dataFrame['received_at']) >= pd.to_datetime(start_date)) & (pd.to_datetime(dataFrame['received_at']) <= pd.to_datetime(end_date) + timedelta(days=1))]About the current day, we include only rows where the 'received_at' column's datetime values are within the last 24 hours from the current time:
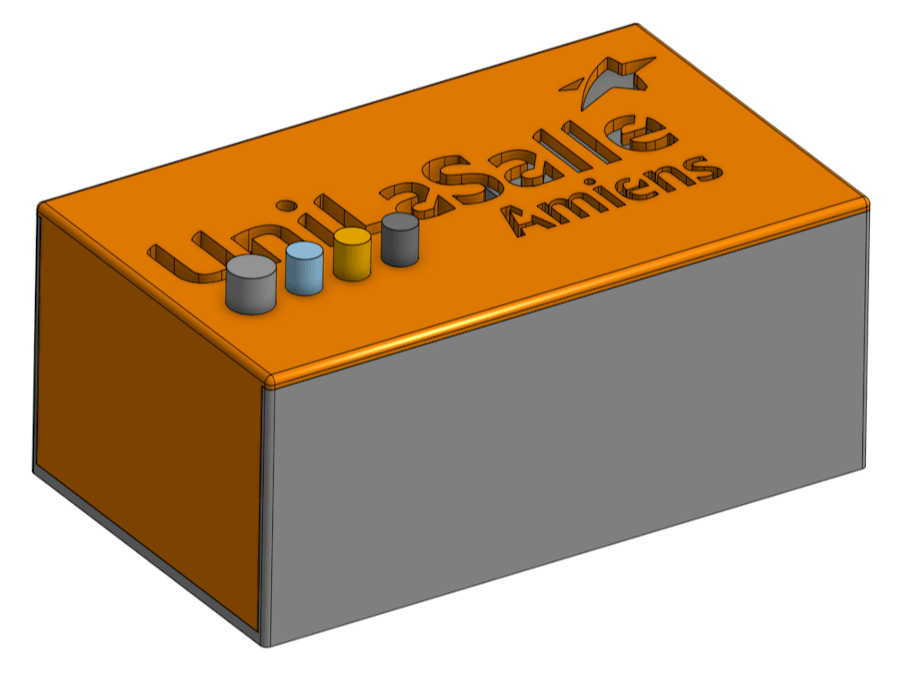
dataFrame = dataFrame[(pd.to_datetime(dataFrame['received_at']) >= pd.to_datetime(dt.now() - timedelta(hours=24)))]For 3D modeling we used OnShape, it is a free CAD software available online. This way we easily shared the documents between us and our different devices.
The LoRa card was the biggest composent and rules the final size of the box.
We made a housing for the PM and VOC sensor in front of the PM sensor to benefit its fan. Holes have been made for the sensors, the relay, the LEDs, the button and the power cable.
Once completed we printed it in PLA and it took around 8 hours for the box and lid to finish.
Main key pointsThis project was carried out in a number of phases. First the research of the main components, then we tested each component, we made the card communicate and backed the storage, a dashboard was developed, and finally we designed and 3D printed the container for our components.
Possible improvementsAs we progressed with our project, we noted a number of areas for improvement that we haven't had time to revisit.
Firstly, we have succeeded in sending data to the LoRa card through TTN to trigger the buzzer and relay. Although we could not do this using our Python script, it is hard to debug as we don’t have access to the information circulating on the TTN broker.
Secondly, we were surprised by the space taken up by the cables in the box. This prevented us from closing the container completely. Reducing the length of the cables, enlarging the box or making a PCB would help us or even allow us to reduce the total size of the case.
Thirdly, since we use LoRa, we could add an element on the dashboard showing the approximated location of the device on a map. This would also allow us to add other devices in different places, useful for companies for example.
Finally, in a domestic use, it would be preferable to connect to the WiFi to ensure connectivity locally. Using another card would also drastically reduce the size needed for the box.
ConclusionThis project enabled us to revisit a number of concepts that we had covered in class this year and to put them into practice.
We divided up the tasks, pooling them at certain key moments, and it was very gratifying to see that our work ran seamlessly as a whole.
We're proud of what we have achieved and look forward to continuing to work on this project.
We hope you enjoyed it and found it inspiring!
AcknowledgmentFirst of all, we'd like to thank UniLaSalle Amiens for giving us the opportunity to carry out this project.
We would also like to thank Mr Dailly and Mr Caron for their guidance and support during this project. We greatly appreciated their help and sense of humor.
Finally, we would like to thank our fellow classmates with whom we were able to compare our points of view and thus improve the project.
Get to know our school and what we work on by clicking on those websites! https://www.unilasalle.fr/ and https://www.unilasalle.fr/parcours-reseaux-informatiques-et-objets-connectes


Comments