


Hardware components | ||||||
 |
| × | 1 | |||
Software apps and online services | ||||||
 |
| |||||
 |
| |||||
| ||||||
| ||||||
Have you ever been staring longingly at a dashboard or MQTT feed and thought, "I wonder what my ESP is doing..Is it alive? Did it reboot? Did it lose connection??Is it running out of memory?! TALK TO ME GOOSE!". Not to mention the effort of getting (and staying) connected to WiFi and MQTT brokers in the first place. And debugging. Don't even get me started on debugging. Sure, if you're using OTA updates, you could re-flash your device every time you want to test some debug output and then flash it back after, but..This is where LinenTools ESP Telemetry Node comes in handy.. How has it helped me?
- Less boilerplate code for connecting to WiFi & MQTT broker has made my sketches cleaner and simpler with easy, robust configuration
- Resilient keep-alive and reconnect logic for WiFi and MQTT broker connections means my devices recover from WiFi and MQTT broker restarts so I don't have to go around my house restarting my ESP
- Telemetry heartbeats let me know my device is alive and well and give me useful device info (WiFi signal, time alive, heap & reset reason)
- Built-in interface logic for remote telemetry control allows me to easily request a heartbeat, change metric rates or tell my device to restart without having to flash new firmware
LinenTools ESP Telemetry Node was built for my personal ESP wants and needs. As a professional engineer, I often want specific things and enjoy building my own tools for a custom fit and personal enjoyment. What started as an effort to make my ESPs reliable, local-only gadgets and to avoid walking around my house restarting ESPs every time I updated my MQTT server, turned into ESP Telemetry Node. It started out as some wrapper code around the standard WiFi and MQTT Arduino libraries that evolved into personal Arduino libraries. Astonished at how much easier and faster setup has been for my own projects and how reliable my ESPs connections are, I decided to share what I made with other hobbyists with similar wants/needs so they could reap the same benefits.
BETA VERSION NOTE:
This beta version DOES NOT have the ability to connect to MQTT Brokers with an SSL certificate (yet, stay tuned to the Github repo for updates or post a pull-request).
Pre-Requisites
- Arduino IDE is installed
- ESP packages are installed and you can flash the "blink" example
1.Install Libraries in the ArduinoIDE
- Sketch->Include Library->Manage Libraries->(search)"ArduinoJson"->Install (ArduinoJson by Benoit Blanchon)
- Sketch->Include Library->Manage Libraries->(search)"ArduinoMQTTClient"->Install(by Arduino)
2.Download LinenTools from Github
- LinenTools RunnableLed v1.0.0-beta Code->Download ZIP
- LinenTools ESP Telemetry Node v1.1.0-beta Code->Download ZIP
3.Install Downloaded Libraries
- Sketch->Include Library->Add ZIP Library->(select LinenTools Runnable LED)
- Sketch->Include Library->Add ZIP library->(select LinenTools ESP Telemetry Node)
4.Close & Re-Open the ArduinoIDE
5.Check for LinenTools Library Examples
- File->Examples->LinenTools RunnableLed->blink
- File->Examples->LinenTools ESPTelemetryNode->BasicUsage
If you don't see the example code, repeat steps 2 - 5 if necessary
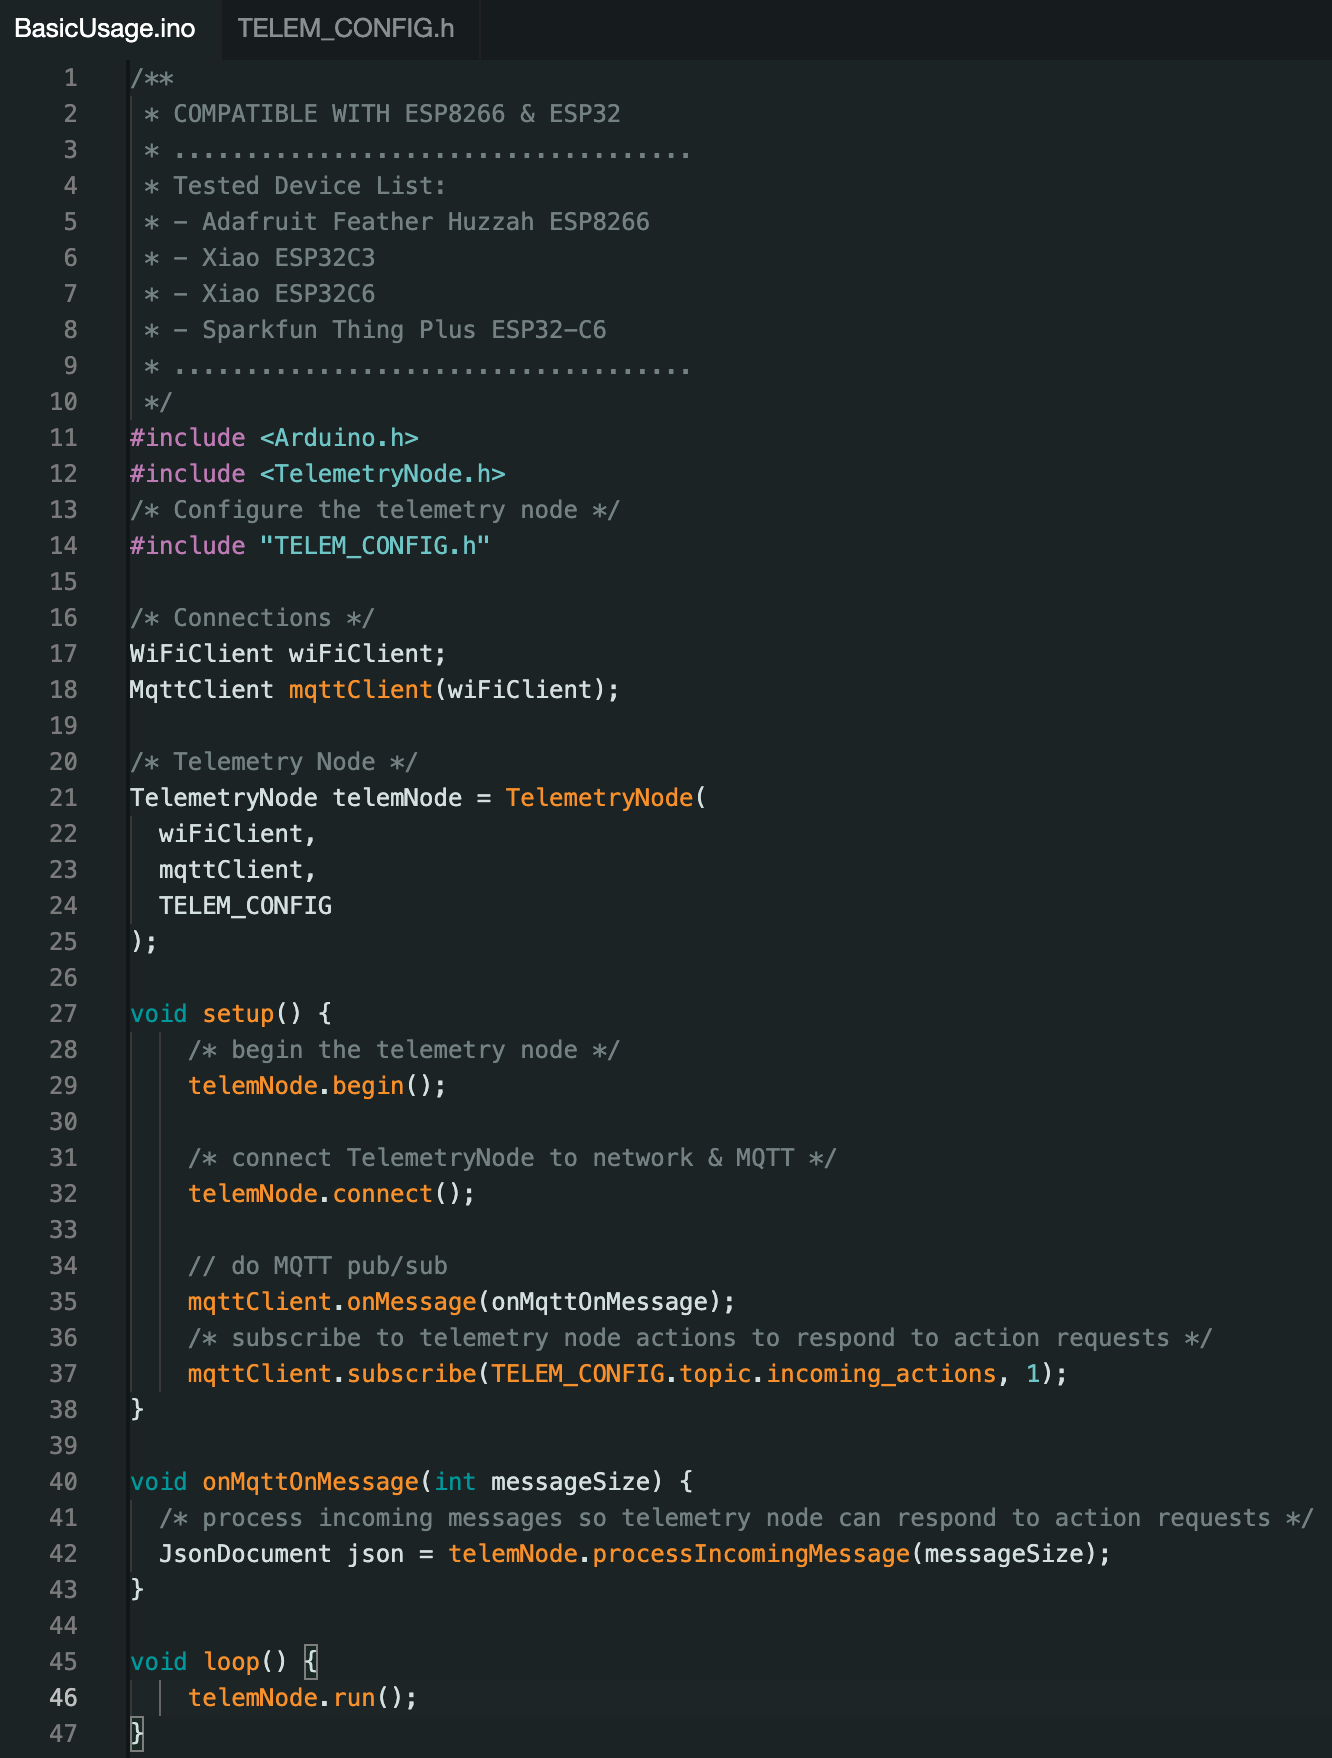
1. Open the Example Sketch
- File->Examples->LinenTools ESPTelemetryNode->BasicUsage
2.Configure the Node
IMPORTANT CONFIGURATION NOTE: Detailed documentation found here
If device heartbeats are disabled in the "Device" configuration section, your Telemetry Node will not publish telemetry metrics.
- Open TELEM_CONFIG.h
- Find and replace "<mqtt-client-id>" with your node id
The MQTT client ID is the unique client name for your device. If two clients have the same client ID, you may have connection issues. I like to give my clients fun and descriptive names like "the-dark-knight" or "doorman-basement".
- Set Wifi and MQTT broker credentials
- Configure and check topic configuration
The topic paths found in the topic configuration section of TELEM_CONFIG.h will determine the MQTT channels your device publishes telemetry information to. These are the topics you can view or subscribe to.
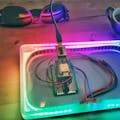
3. Connect your ESP & Upload
- Connect your ESP
- Sketch->Upload
4. Check Serial Output
- Set Serial Baud rate to 115200
- Verify your connection variables are correct and that your device connected to the network and MQTT broker
5. Check MQTT Telemetry Topics (usingMQTT Explorer)
With the following topic configuration
You can see my ESP32C3's telemetry information using MQTT Explorer
By default, the telemetry node will listen for incoming JSON action requests on the "/actions" topic.
To request a heartbeat, send a JSON message with a 777 action to the actions interface.
In the telemetry channel, you should see updated telemetry metrics
- Try remotely Rebooting with 999
- Disable heartbeats with 666
- Change telemetry heart rate with 444
Detailed documentation found here


Comments
Please log in or sign up to comment.