I always wanted to work on Internet of Things as it changes our day-to-day life and literally has endless possibilities of use cases, but I didn't get some reputed and interesting tutorials for the same. When I come across the Internshala IoT training cum competition I couldn't resist myself from doing it at here is the fruit of the training.
This project is about building a Temperature Monitoring Device using Bolt IoT Module. The device sends an e-mail to the user whenever the temperature of the surrounding (wherever it is used) crosses a certain threshold which is previously defined.
Here is the project in action :
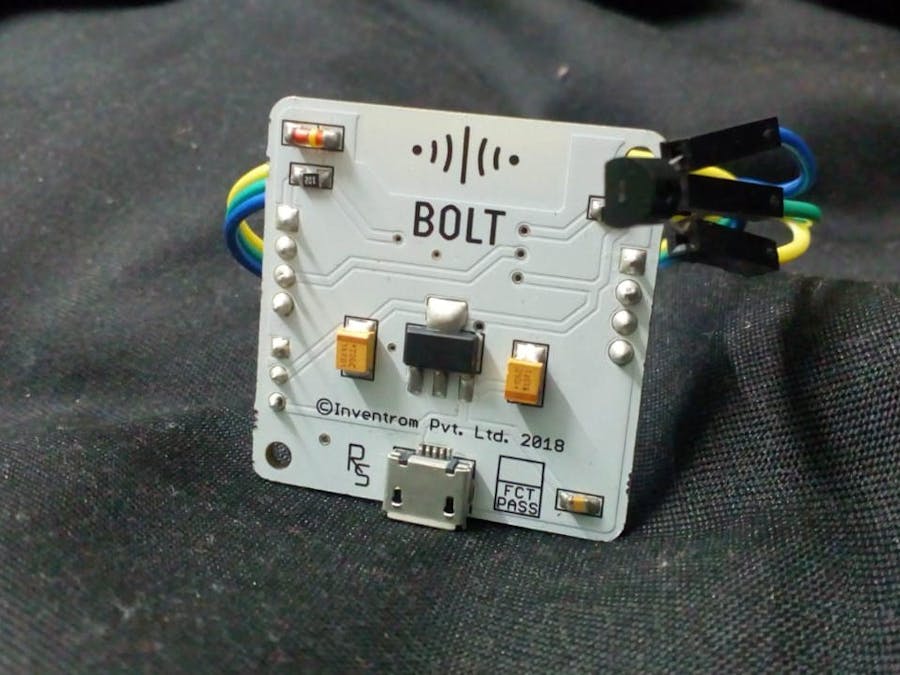
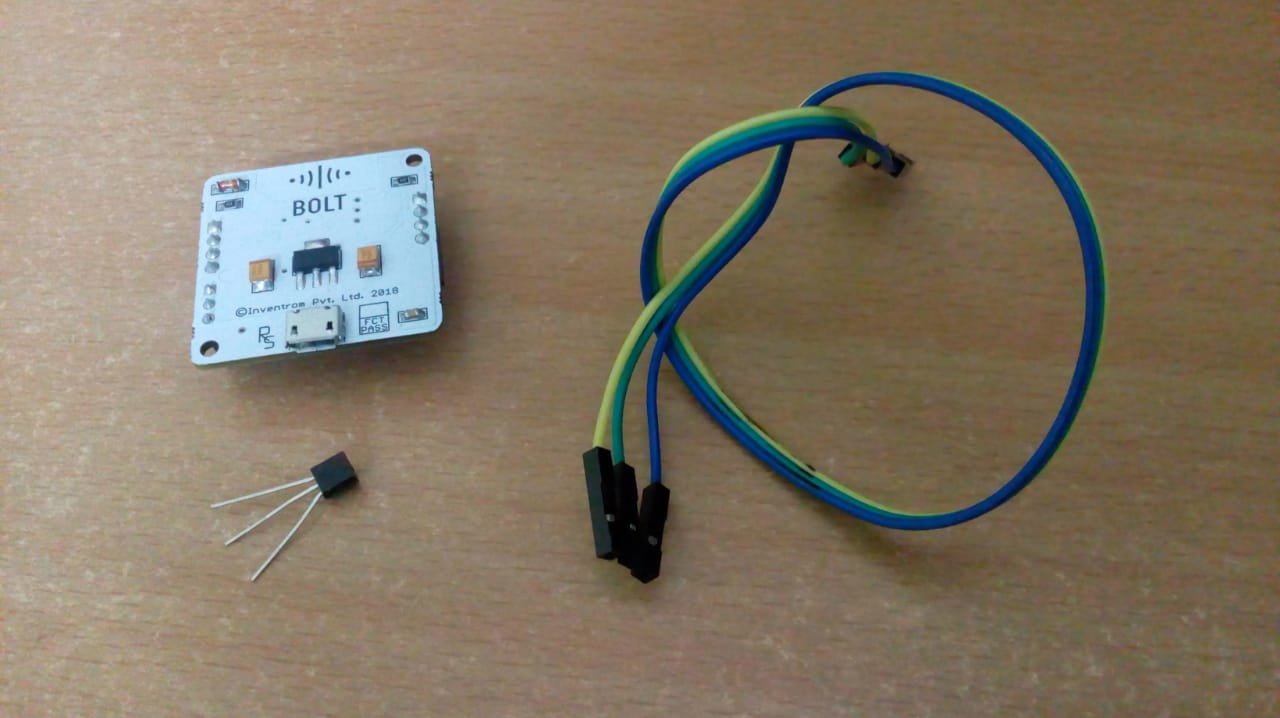
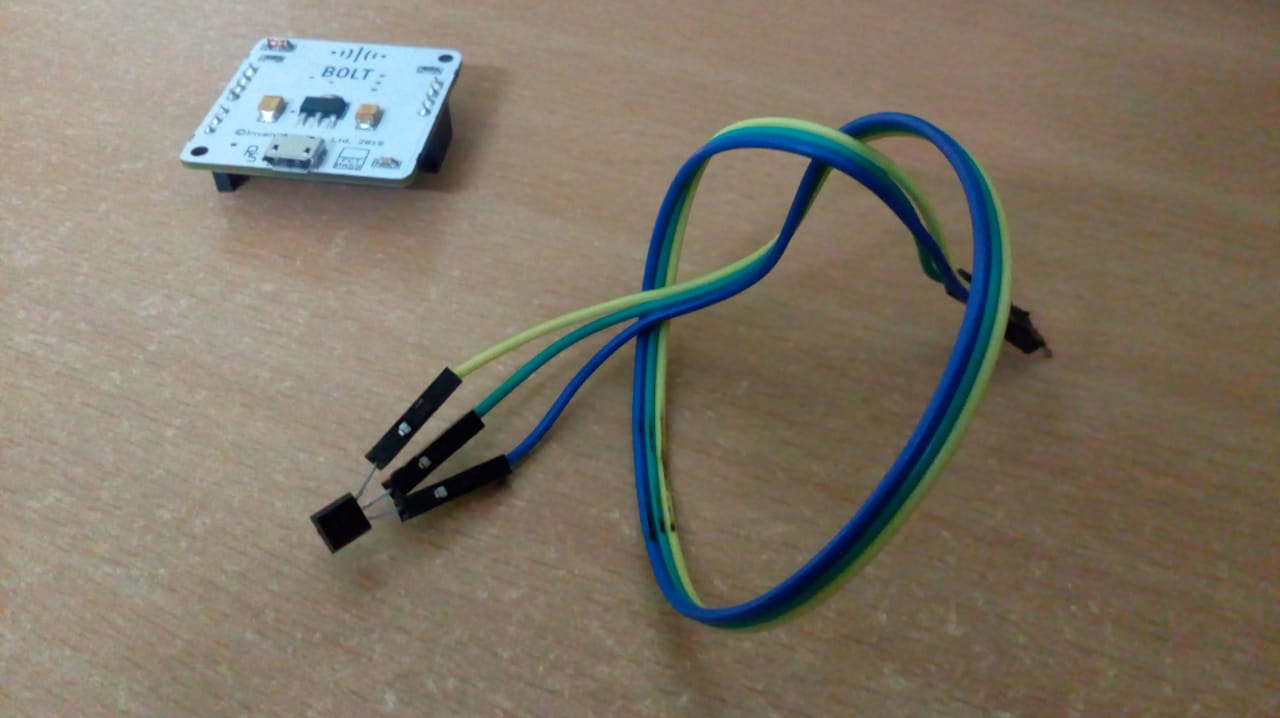
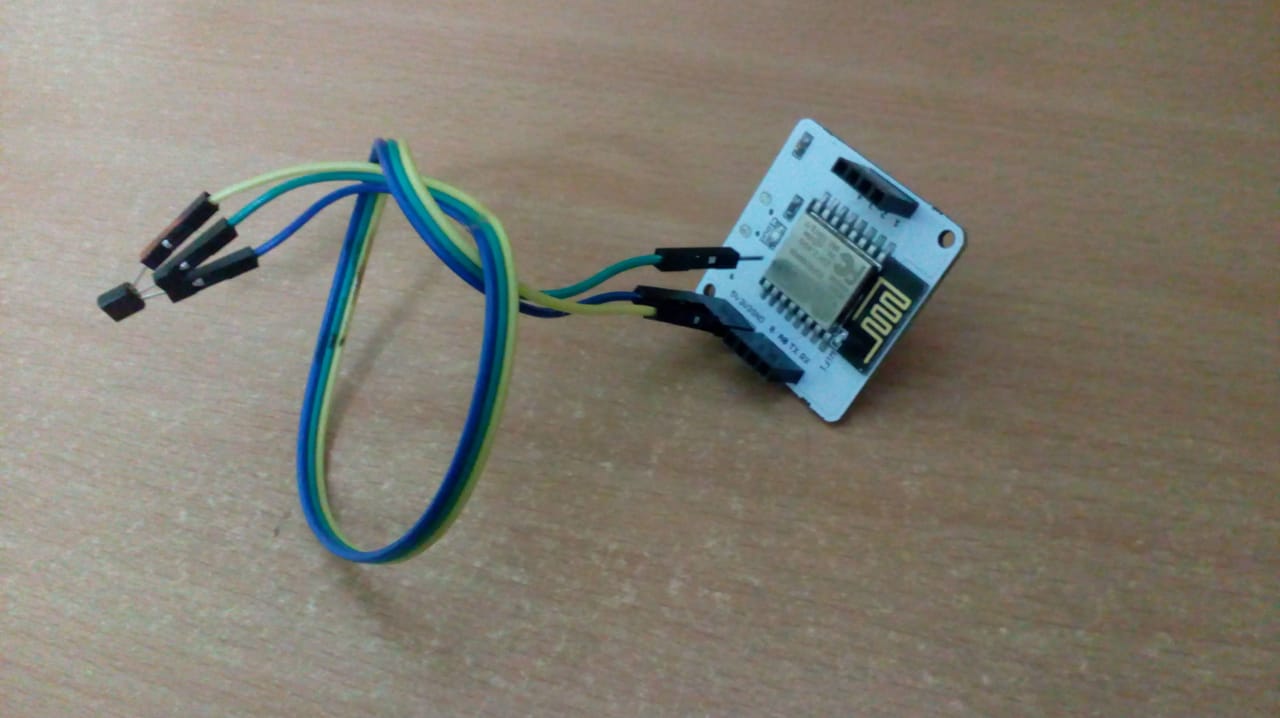
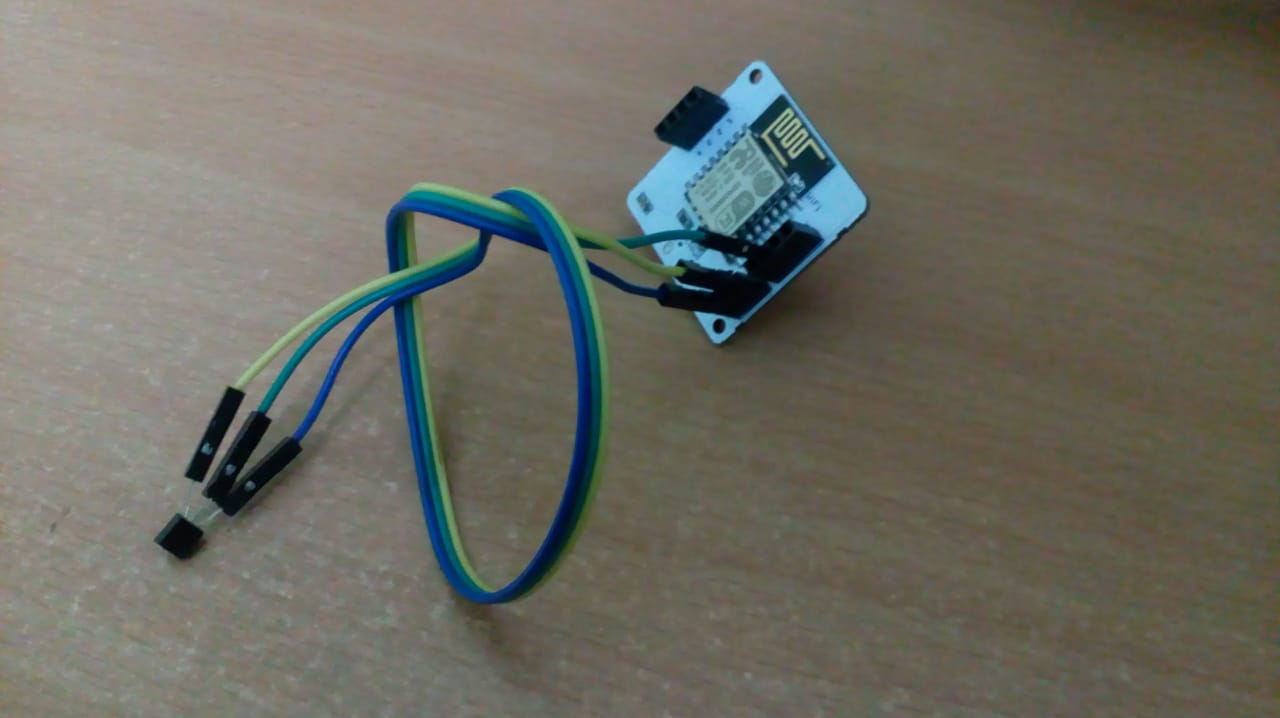
I am assuming that the Bolt IoT module is already connected to your system and with a stable internet connection.Step 1 : HardwareSetup1. The three pins of LM35 sensor are connected to the female end of the 3 wires.
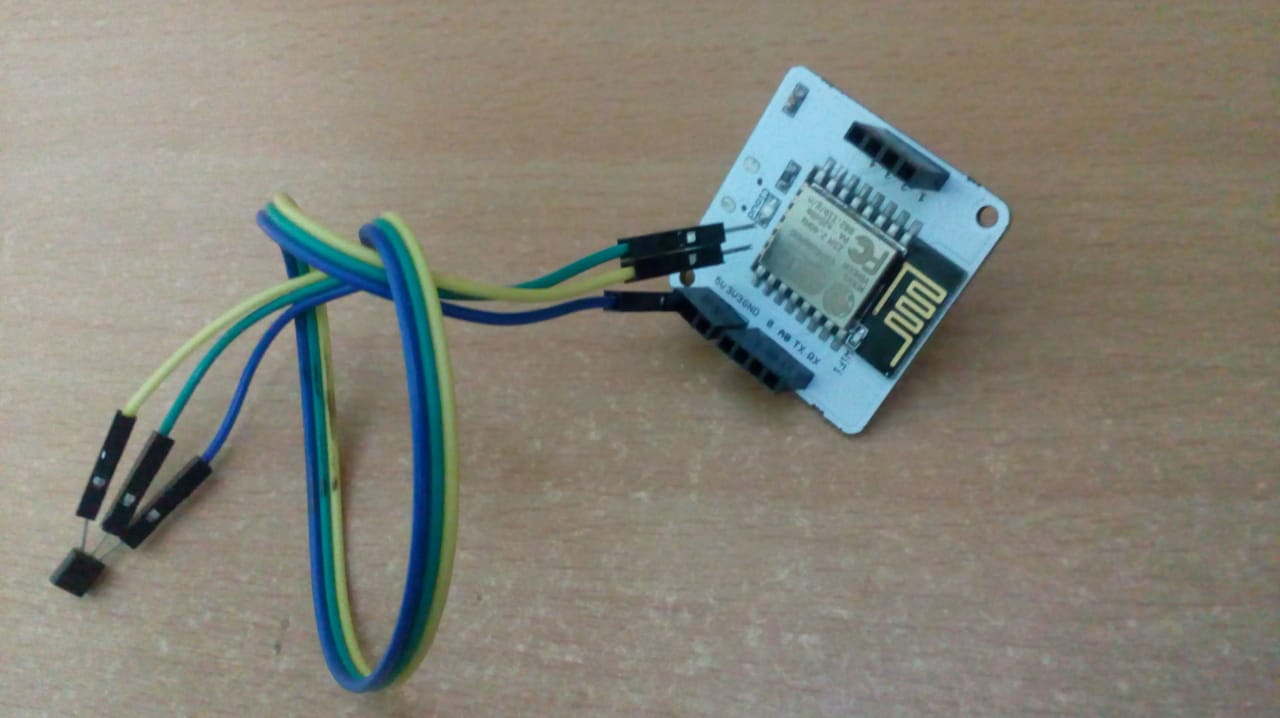
2. The blue wire is connected with the sensor pin, green wire with the output pin and yellow wire with the ground pin. The male ends of the respective wires are connected to the 5V input, A0 and ground (GND) of the Bolt IoT module respectively.
3. The final connection will look like this.
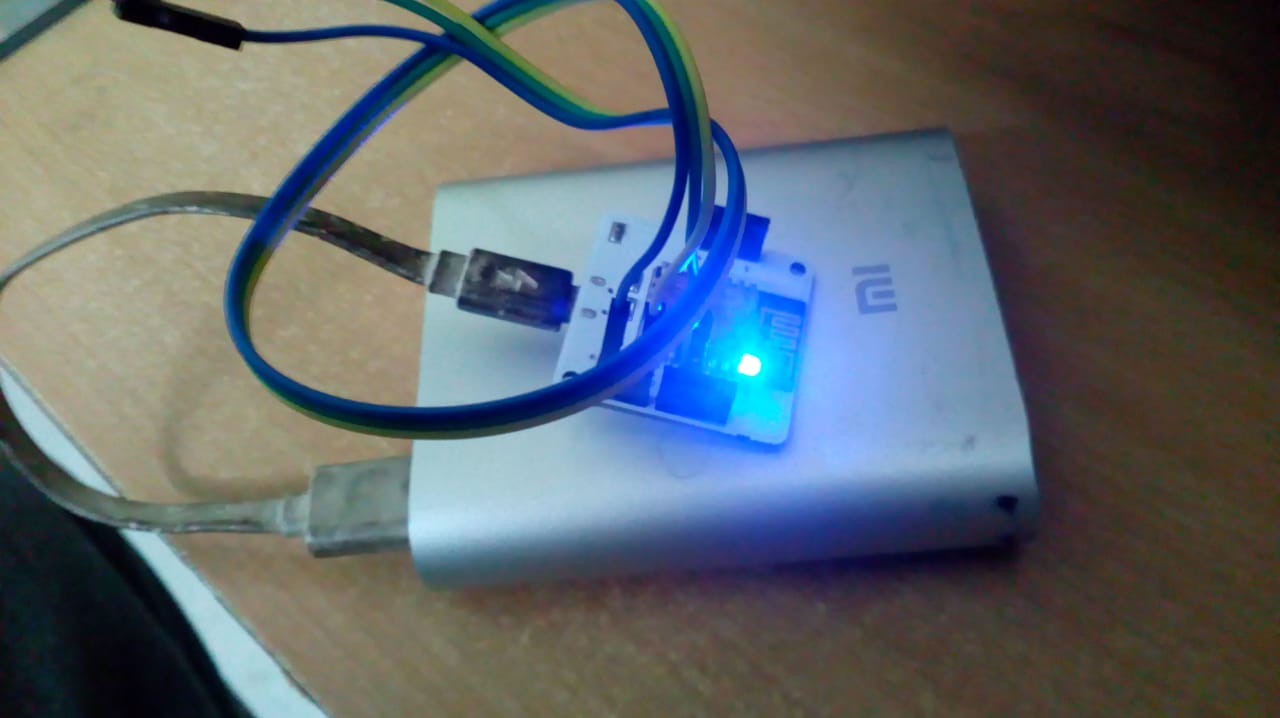
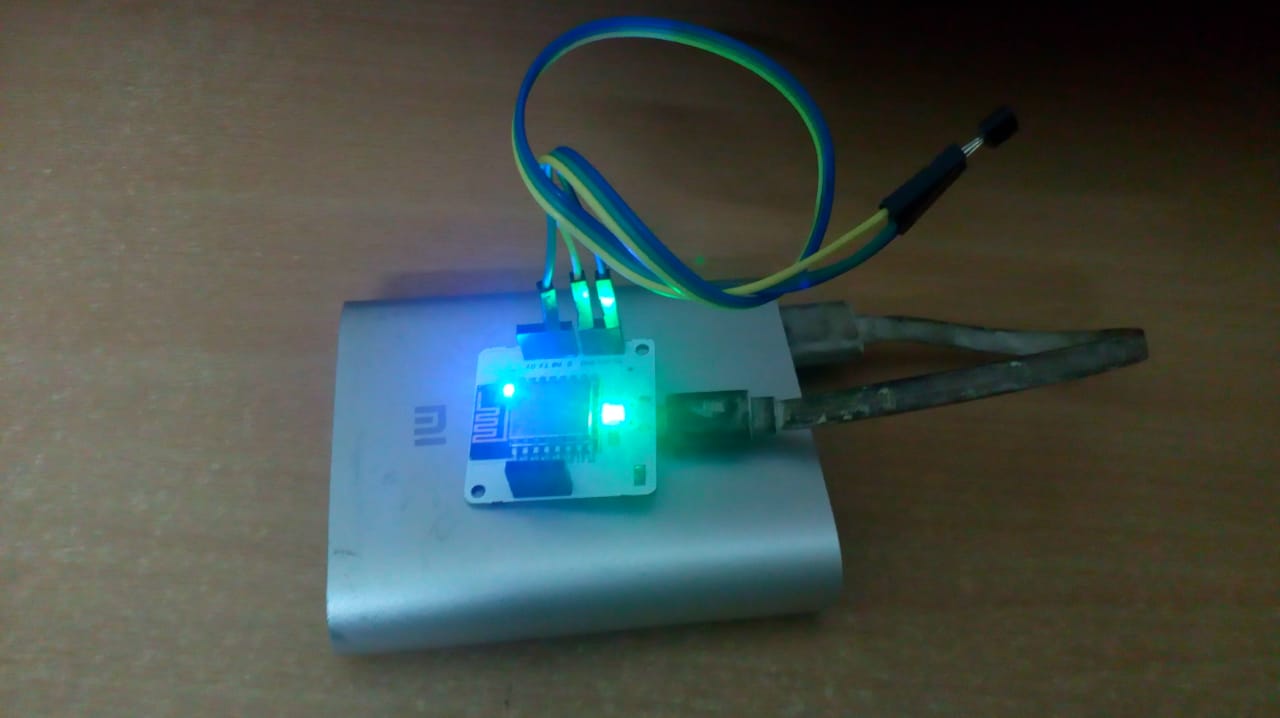
4. The Bolt module then needs to be connected with a portable power source (because we need to move the device to a particular place for temperature readings).
5. The device then needs to be connected with a stable internet connection.
Hardware connections are complete.
Step 2 : ConfiguringandDeployingdeviceforpredictions
1. Login to https://cloud.boltiot.com/, click on products tab and add a new product. The product will be an output device with collection data as GPIO.
2. After adding the product click on "Configure this product" on the top right corner to configure the product. Configuration screen will open.
3. In hardware configuration, we have connected the LM35 sensor with A0 pin of the module so mark check the A0 pin and write a variable name for it.
4. Now we need to write the code for the predictions in the code section. The code is written in JavaScript. The code first import the 'google-chart' library so that we can use it's graphs. Them we write a title for our graph. Them we choose a chart which we need to use (we used predictionGraph). Then we named the axes of the graph (x, y). We then set a multiplication factor. And at-last we plotted the points on the graph.
5. We then save the code after which we will link our bolt device with the product by clicking "Link device to this product" button present on the top right of the screen and then choosing the Bolt Device.
6. Once we linked the device, we then deploy the configurations to our device so that it work according to what we have configured in the product. After deploying the configuration it's time for some action. We place our bolt device to a place of which we want to check the temperature (I have place my bolt device in my refrigerator to get the readings) and the reading will be plotted in the graph.
7. Let the device take readings for sometime (I left my bolt device for 3-4 hrs to take ample of reading for future predictions). Remember, the more readings you take the better predictions your device will show.
8. Once you are satisfied with the amount of the readings you took, download the data as.CSV file for further use and click on the predict button below to predict the future temperature. The 3 variables predicted points, no. polynomial coefficients and frame size are used to fit our predicted graph and help us to get better and more accurate results. Predicted points defines the number of future points which we want to predict. Number Polynomial Coefficients define the polynomial coefficients for the prediction. Frame size defines the number of previous readings used for the prediction.
Temperature prediction is complete.
Step 3 : TemperatureMonitoringbyprocessingtherecordeddataandZ-scoreAnalysis.
1. First get the bolt API key by clicking on the API Tab and under the section for Generate Key, click on Enable.
2. Then build a mailgun account by going to https://app.mailgun.com/sessions/new this will be used to send email notifications for temperature management. After creating the account. Get the mail ID and mail API key.
3. We will now write the configurations for our device in python. The configurations will include the Bolt device ID, Bolt API key, Mailgun sandbox URL (sandbox_url), Mailgun API key, sender email (test@sandbox_url) and receiver email (your email). Apart from these the configuration file will also have frame_size and multiplication factor for Z-score analysis. A sample configuration file is also provided.
4. After writing the configuration file, we write the python code for temperature sensor.4.1. We downloaded the data which we recorded previously and read it in our code using the pandas library. We remove the first reading as it is a reading of room temperature (you may need to adjust the data accordingly). After the data is read we find a minimum and maximum range of the data which will act as a threshold for our device (thresholds can also be defined according to the needs of the user).
4.2. We then build a function for Z-Score analysis. The function will return "None" if there are less number of reading and will return an array of upper and lower bounds if the Z-score analysis is complete.
4.3. We then configure our code with bolt device and e-mail alert API (mailgun) and also initialize an empty array which will store the data.
4.4. Now we write the monitoring and mailing code in a while loop which will run endlessly because the temperature should be monitored every time. In the while loop we have first printed the history data, minimum and maximum threshold values. The output from the Bolt device is then stored in a variable named 'response'. We then fetch the sensor value from the response. We then run the function for Z-score analysis using the history data, and frame size and multiplication factor from the configuration file. If we get the bounds from Z-score analysis then we will move further, otherwise it will print "Not enough data to compute Z-score. Need more data points". Once the upper and lower bounds are calculated, we will then check the sensor value, if it is between the minimum and maximum threshold, then no mail will be sent otherwise the device will mail the user alerting him about the temperature. And using Z-score analysis, the device will mail the user if there is any sudden change in the temperature (or sensor value).
4.5 Also remember that the sensor value are from the range for 0-1023, so the readings are in this range only. To get the actual value of temperature, divide the sensor values by 10.24
5. The code is now complete and we run the code and hence the device using the python command on terminal. The complete python file for the code is provided.
Now you are up for action.
Thismarksthecompletionoftheproject.
Now monitor you room temperature and show-off your device. All the code is provided for your help. I sure had fun working on this project hope you guys feel the same.
ThankYou!






Comments
Please log in or sign up to comment.