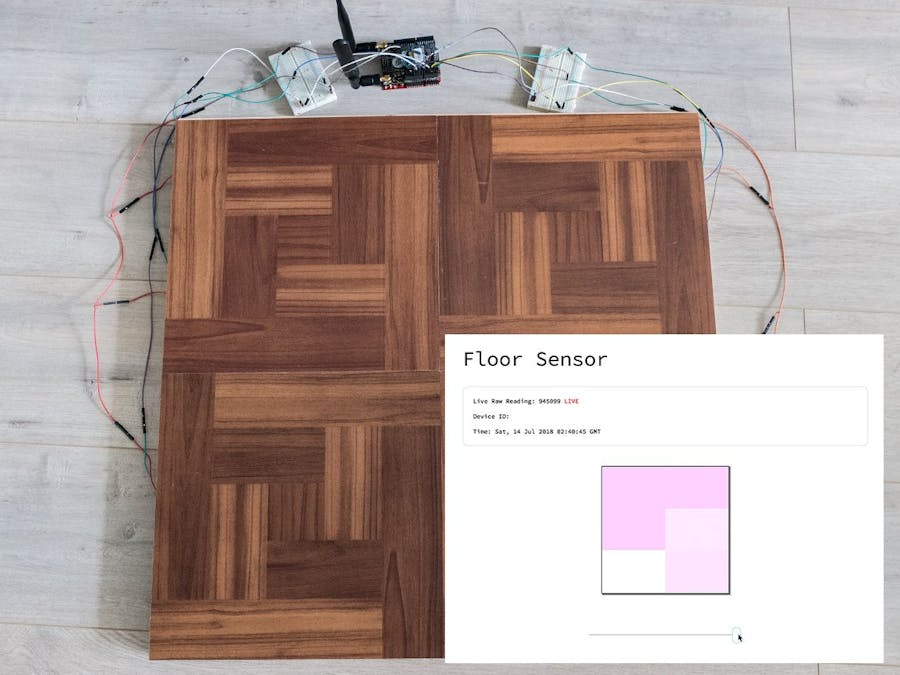
It goes without saying online traffic takes the limelight when it comes to analytics. However with the Internet of Things becoming increasingly accessible, physical traffic analysis is starting to gain traction. With everything from cars to the factories that make them, there's a large market looming for digitizing and analyzing what happens in the real world.
Foot traffic is particularly interesting because it taps into something deeper and more innate in our psychology. How do we physically react to environmental stimuli? What are the movements we tend to make depending on the circumstance? Understanding these patterns can allow us to make more informed decisions about what we build and the how we treat the space around us. The applications can span from government to retail to entertainment to commercial industry.
Why Helium?Using pressure sensors to measure foot traffic can be a natural complement to other forms of crowd analysis (proximity, computer vision, infrared). While many visual or distance sensors can be obstructed, pressure sensors can be embedded into flooring making it invisible and unobtrusive.
By utilizing wireless Helium sensors, we cut down on costs for installation (wiring / connectivity) and increase portability. That way you won't have to rewire your entire stadium area or dig up a National Park to put in a swath of sensors. In addition, having a perpetually connected sensor can allow you to see near real-time data instead of occasionally syncing and only having access to historical data.
Key Feet-uresDespite being a proof of concept, this project aims to demonstrates a few data milestones:
- Near real-time
- Historical
- Granular time resolution (sub second level)
The most challenging problem to solve was that of data granularity. The Helium Atom is currently capped at sending roughly one transmission every second. Viewing anything at 1 fps is a bit painful so we had to work around this limitation to extract more resolution.
In order to do this, we took readings every 1/10th of a second and aggregated it into a single payload.
Single Reading (Each digit is a sensor sensitivity reading from 0-9)
004291
Aggregated Reading (Payload containing 1 second worth of readings)
004291513292000402004922004920034291014291040402004720062950
On the client side, the payload is then broken up back into separate readings, and the UI plays the readings back at the correct speed.
Client UI (Breakup payload and push into array)
[ 004291, 513292, 000402, 004922, 004920,
034291, 014291, 040402, 004720, 062950 ]
We sacrifice a bit of liveness in order to achieve this, but the resolution improvement we are able to get from the slight delay is well worth it.
ArchitectureA). Helium sends sensor data to Google Cloud IoT Core
B). Data Aggregator parses incoming data from Google IoT
C). Data Aggregator emits parsed data via Socket.io
D). Data Aggregator stores readings periodically to Google Firestore
E.) Client UI takes incoming sensor data and displays it graphically
F). Client UI queries Google Firestore through the Data Aggregator to access historic sensor data
The BuildThe total cost for the hardware comes out to around $300. The most expensive piece of the build is Helium Starter Kit ($160). If you already have an Arduino and some Force Sensing Resistors you can cut some of the costs. I bought some vinyl stick-on tiles to make the project look a little more appealing, which is completely optional of course. The end goal of the build is to sandwich an array of sensors between two boards to detect the pressure when someone steps on top.
- SparkFun RedBoard ($20)
- Wall Adapter Power Supply ($5)
Fairly self explanatory. The SparkFun RedBoard is the generic equivalent of the Arduino Uno.
- Helium Startup Kit ($160)
This is the magic! The Helium environment makes it super easy to set up a channel and start transmitting data directly into Google Cloud. Having had experience with XBees in the past, this was extremely simple to configure.
- (6x) Square FSR Sensors ($54 Total)
- (6x) 10k Ohm Resistors ($1)
- (2x) Breadboards ($5)
The simple Force Sensing Resistors decrease resistance as pressure is applied. Connecting it to the analog pins of an Arduino produce a range of values between 0-1000.
- (2x) 2'x2' Wooden Board ($20 Total)
I could have bought one 2'x4' board and cut it in half and saved about half the cost but I didn't have a lot of time. You should also consider MDF since the smooth surface might be better for accurate sensor readings.
- (4x) 1'x1' Vinyl Tiles ($4 Total)
Cheap way to make the floor look presentable
- 2'x8' Rug Gripper ($14)
I wanted a thin cushion that could sit on top of the sensor but between the two boards for two reason: 1). to protect the sensors and 2). to provide grip between the two boards
Step 1: Test the sensors
We want to make sure that everything is in working order before we proceed. Nothing sucks more than stringing everything together only to realize that one of the sensors are faulty.
Rig up your Arduino by following this example. Swap out the sensors and make sure all 6 work properly.
Step 2: Rig up the Helium
Attach the shield to your Arduino and snap on the Atom and the antennae. At this point I would test all the components to make sure everything is in working order.
- Tweak the sample Arduino code to make sure the channel name matches the Google Cloud IoT Core channel name you created.
Change this line: #define CHANNEL_NAME "Helium MQTT"
To this line: #define CHANNEL_NAME "Google Cloud IoT Core"
Once you are finished with the tutorial and uploaded the code to the Arduino, you can navigate to your Helium Dashboard and see that your Atom is connected, and that it is sending data to your Hub that is receiving that data.
Step 3: Prepare the sensors
Out of the box, the sensor connectors are fairly short. For ease of assembly I decided to solder them to jumpers. To do so, snip off one end of the jumper making sure the intact end is male. Strip about a 1/2” of the wire and make a loop where you can slip in the connection points of the sensor. If you don't do soldering much (like me) it may be worth it to buy some extra sensors in case something goes south. It would be a good idea to retest the sensors (Step 1) after you are done soldering.
Step 4: Attach sensors
Divide the board into sixths and find the center point for each section. Cut out a roughly 2’x2’ square piece of the rug gripper to match the board. Use a marker and mark the center points from the board onto the gripper.
Place the sensors facedown on the center points and use some packaging or duct tape to tape it in place. Make sure there is enough wire from the connectors to reach beyond the sides of the board.
Step 4: Wire it up!
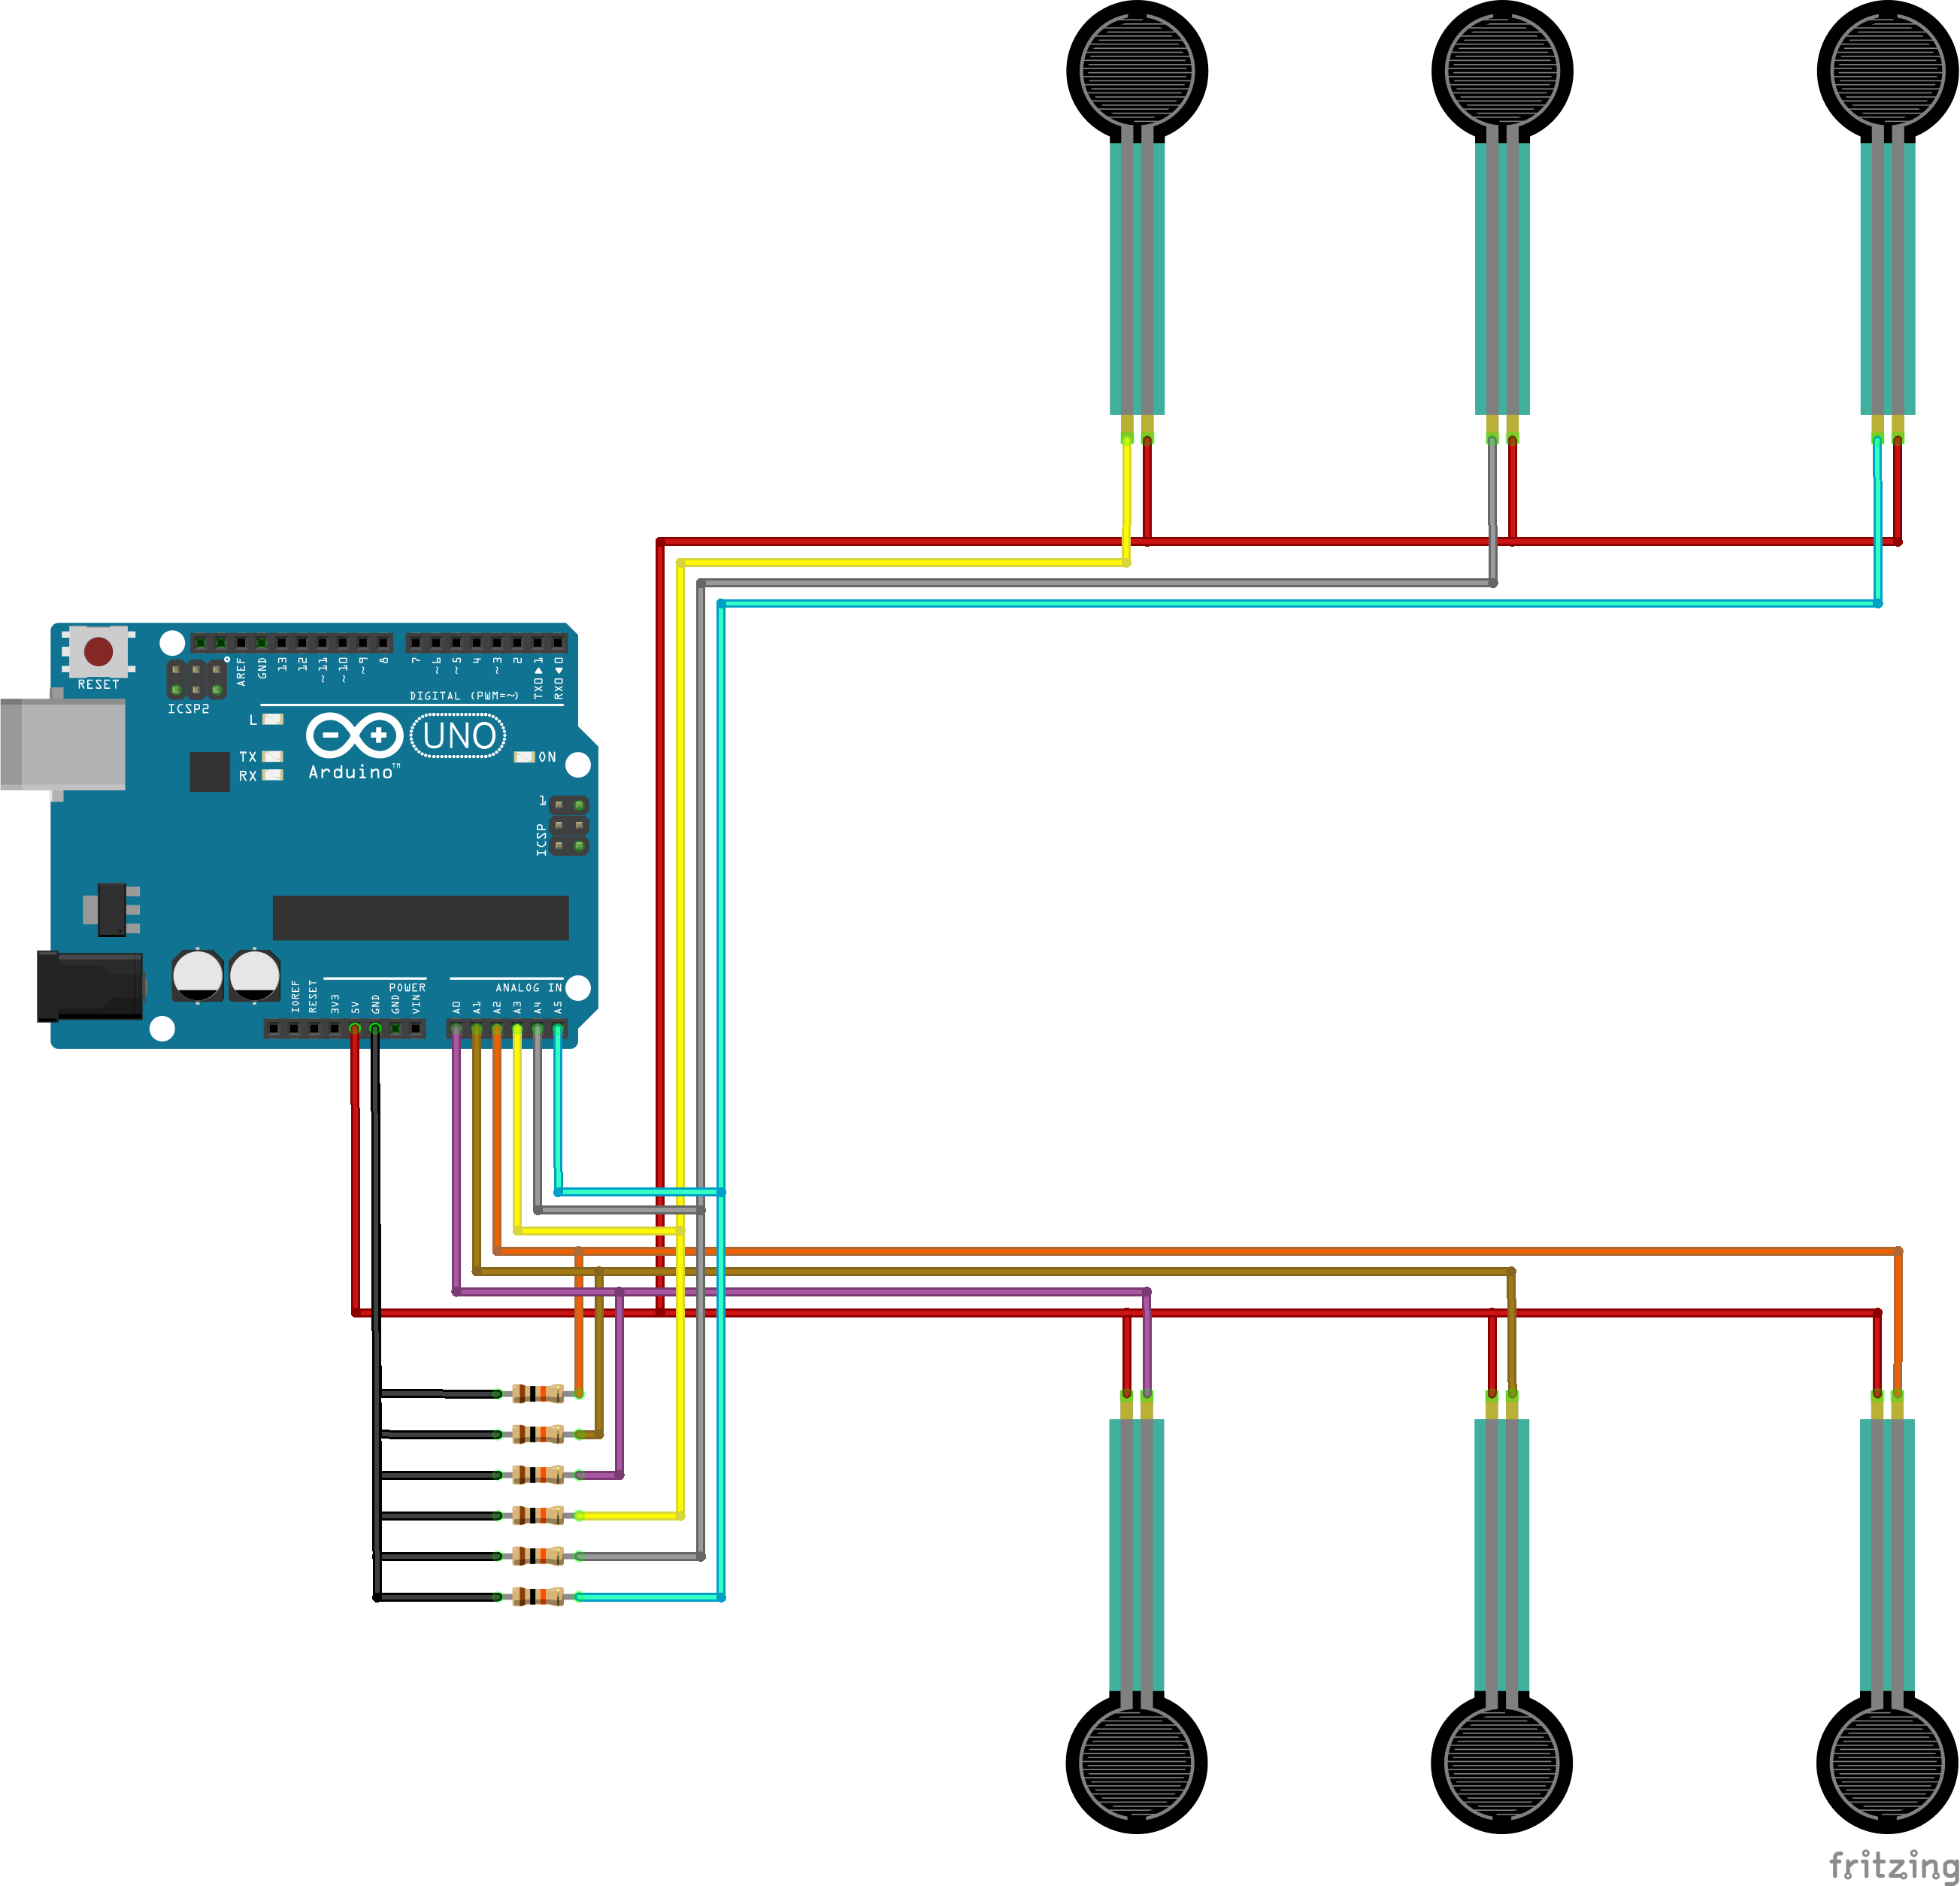
Once the base board is done, you can wire everything together to the Arduino according to this diagram below. (Ignore the circular sensors, I couldn't find the square ones in the software).
It might look complicated, but it's basically the same configuration as the sensor testing schematic but replicated across six inputs:
All the code is broken up into three main segments. The Arduino code, the Data Aggregator service, and finally the front-end Client UI.
Arduino Code (C/C++)
- Collects readings every 1/10th of a second
- Processes readings into compact format
- Sends processed readings every second to the Helium Hub & Google Cloud
It is recommended that you use the Arduino IDE for editing this so you can upload it directly to the Arduino for testing. The code uses the provided Helium Library to push data to the Helium channel.
Data Aggregator (Express, Socket.io, Google PubSub, Google Firestore)
- Subscribes to real-time data from Google IoT using Google PubSub
- Splits payload back into 1/10th second readings
- Emits reading data in a steady stream via Socket.io
- Periodically saves historic data to Google Firestore
- Expose endpoints for Socket and Firestore querying
This service is the heart of the application and does much of the heavy lifting when it comes to making sense of the data. Express was used to quickly setup endpoints for the Client UI to consume. For public deployments, we can use Zeit to quickly deploy our service.
Client UI (Next.js, React, Socket.io)
- Serve UI with Live view of sensors
- Read data from Data Aggregator
- Take user inputs to access historic data
The Client UI shows a graphical representation of the board and corresponding sensor pressure on a near real-time basis. It also incorporates a slider that allows the user to scrub through the last 60 seconds of readings. We'll be using Next.js for its server side rendering capabilities. For public deployments, we can use Zeit to quickly deploy our service.
The ResultAfter uploading the Arduino code, deploying the Data Aggregator and the Client UI, use a browser to navigate to the URL for your Client UI. You should be able to see a screen similar to this:
After stepping on the floor sensor and walking around a bit, you should see something similar to the demo below:
Upon using the slide you should also be able to see historical data like so:
Admittedly this is a rough prototype and if I had more time and money I would like to invest in improving the physical build as well as the application itself. Below are a few of the considerations for future expansion on this project.
- Better build quality: Instead of using jumper cables, I would probably solder all the connections with dedicated wiring. Also, I would consider using heat shrink wraps for some of the connectors.
- Prefab boards: Creating your own board with built in components would drastically lower the footprint of the Helium Atom on the board, making it much more portable.
- Custom antennae built into flooring: Another consideration for lowering the footprint would be to conceal the antennae in a more discreet manner.
- Replace Firestore: Google Firestore is not meant for time-series data, and thought it makes a good data store for a proof of concept, running more production level numbers could prove to be expensive.
- Linkable boards: To be more commercially viable, it would be useful to show a prototype that could automatically detect a floor plan. By making boards linkable and able to broadcast metadata to each other, the Client UI can automatically assemble a floor plan view of the boards.
- Code abstraction: A lot of values in the code are currently hardwired. Preferably, we can use config files and make the parameters customizable (e.g. sensor count, liveness vs time resolution tradeoff, etc).
- Inverse pressure detection: An additional feature to increase functionality would be the ability to detect when something isn't on the board. This effectively means building a tare function and displaying negative pressure.
- Application improvements: Alerting and notifications for when a specific measurement is detected.
Thank you for taking the time to read about my project! Let me know if you have any questions.


_3u05Tpwasz.png?auto=compress%2Cformat&w=40&h=40&fit=fillmax&bg=fff&dpr=2)
Comments
Please log in or sign up to comment.