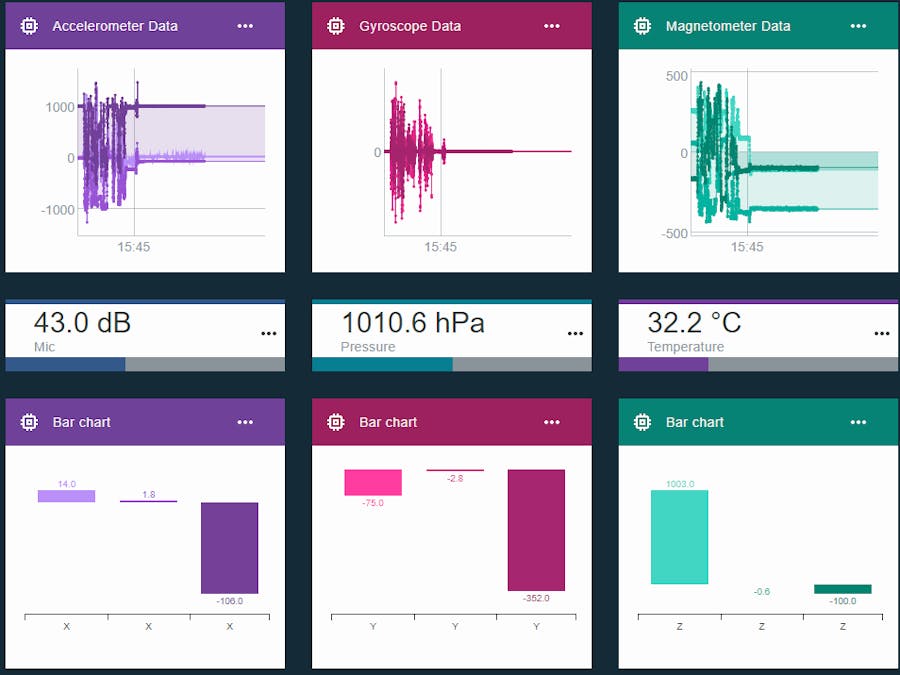
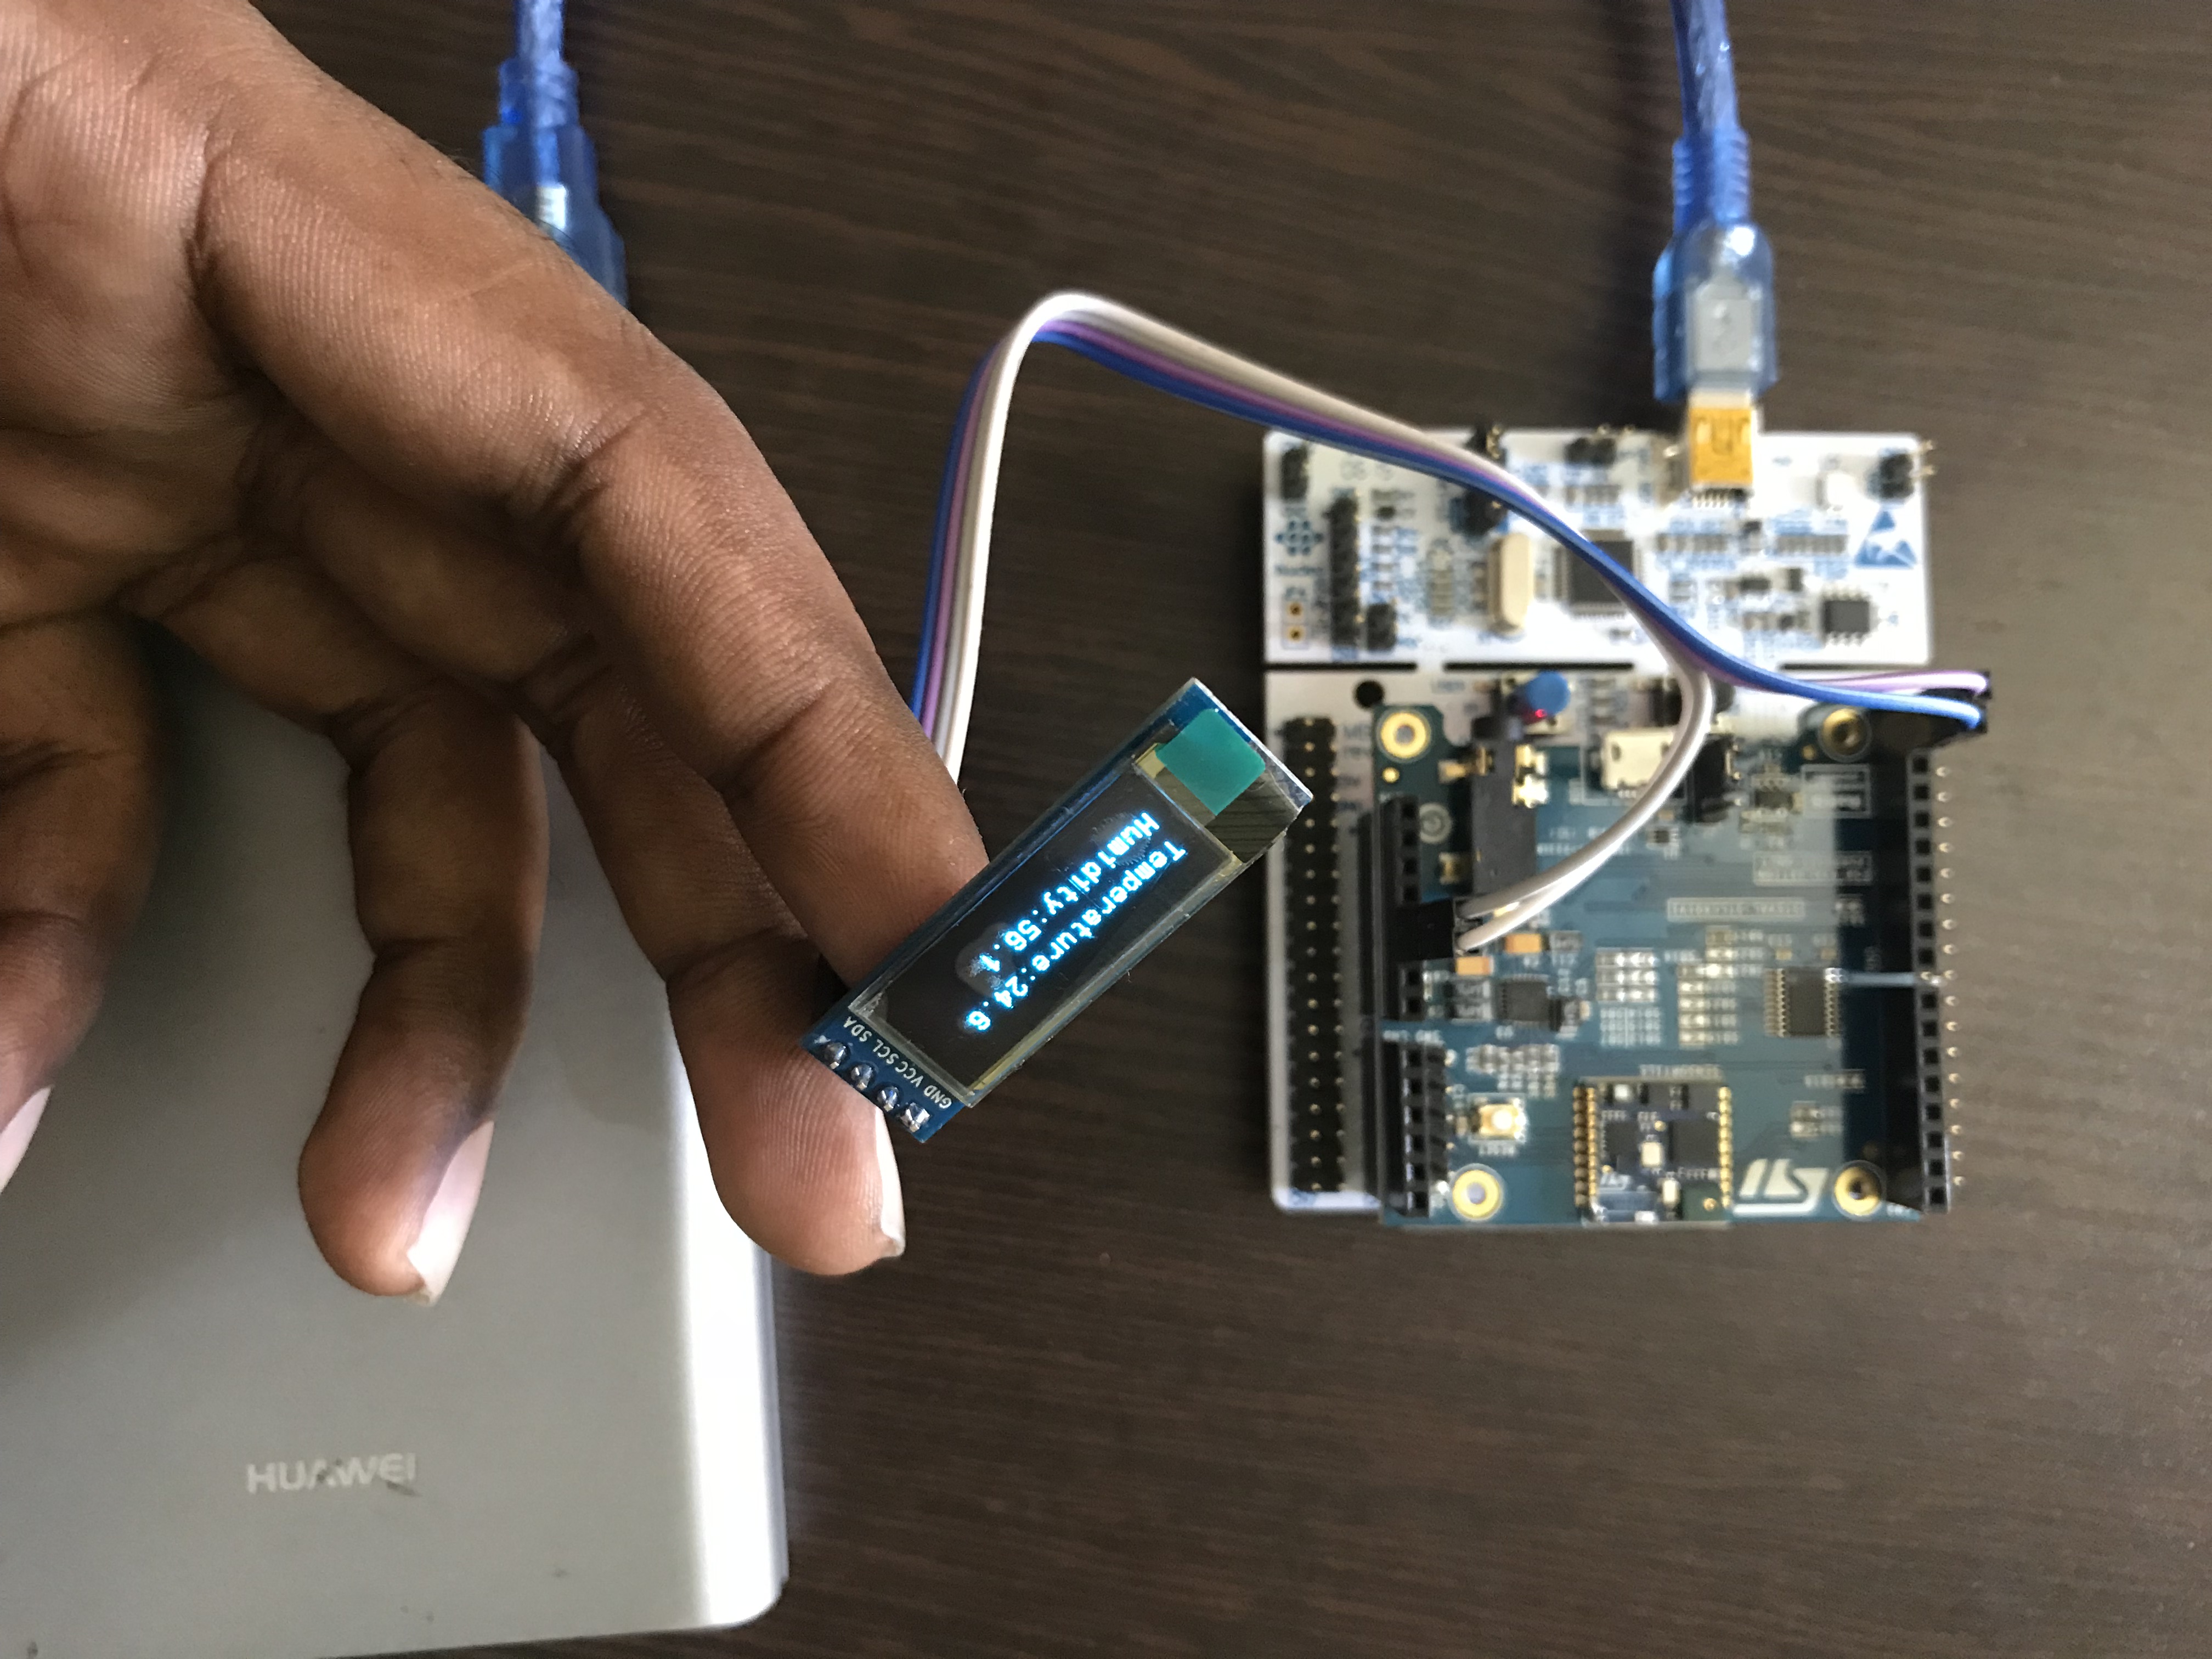
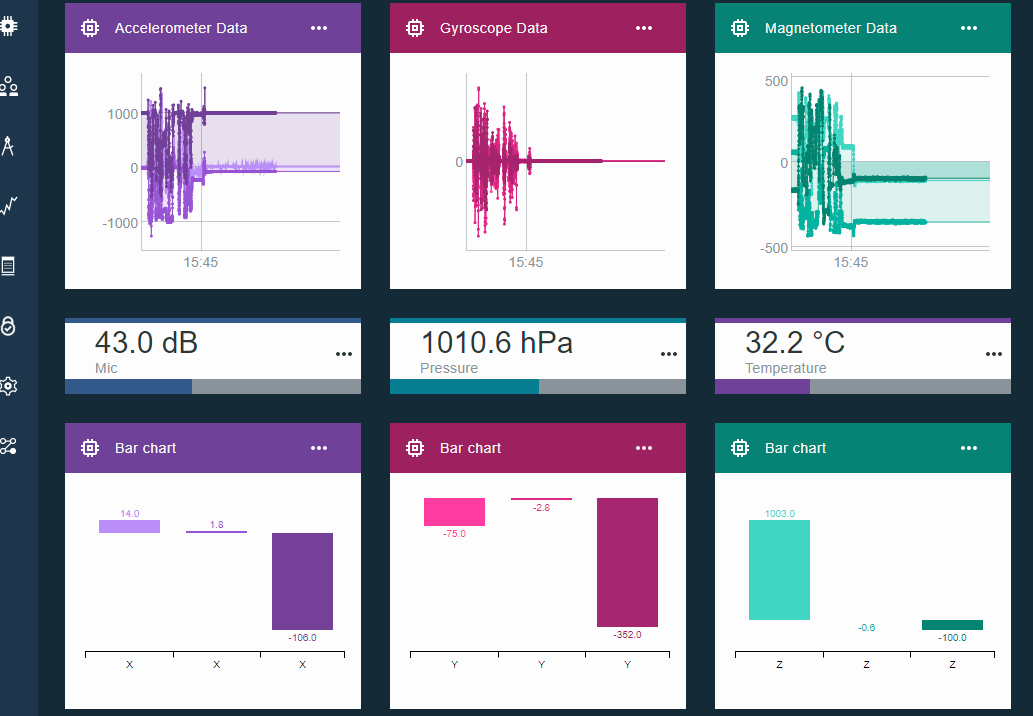
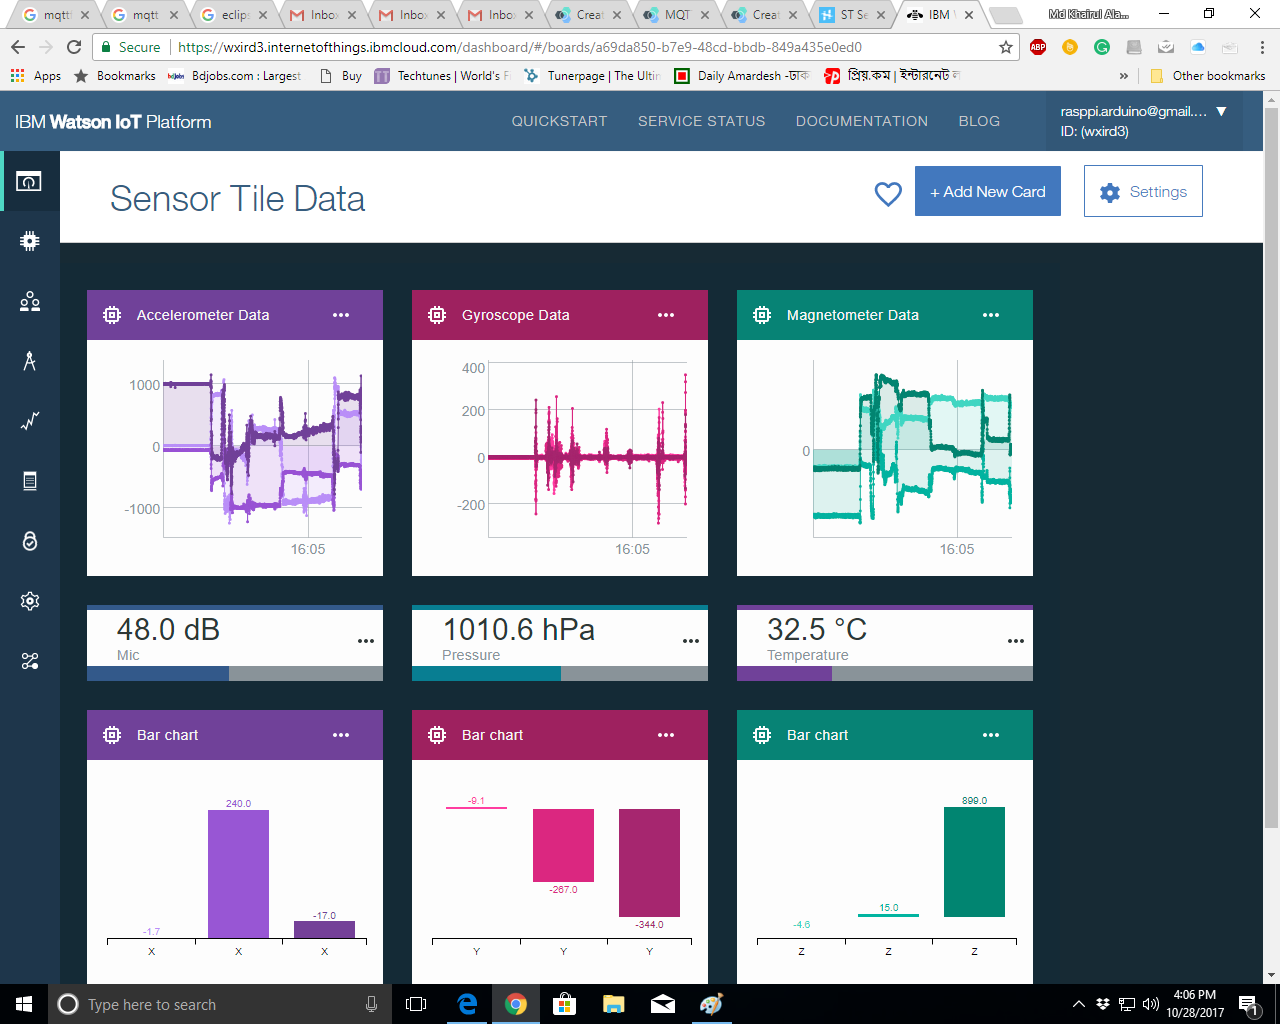
In this tutorial I will show you how you can observe SensorTile data in IBM Watson IoT dashboard in real time. I will also show you how you can get notification if any sensor data exceed a specific value. So, lets get started. To get the data from SensorTile to Watson dashboard you first need to create an account in IBM Watson IoT Platform.
Step 1After successfully log in to your dashboard first click on Create New Board. You will get following interface. Give a Board name (e.g. SensorTile) and click to Next.
Then create a device type by clicking Create device type button.
Type a device name (e.g. SensorTile). You can also add a description and then click to Next.
If you like to add any device property like manufacturer or serial number then click to related check box or boxes.
I added only the Manufacturer name (e.g. STMicroelectronics).
You can escape the step for Metadata.
After creating a device you have to add the device to your dashboard. To do so go to the DEVICE tab and click to Create A Device. From the Add Device window select the created device from the Choose Device Type drop dawn and click to next.
SensorTile is added from drop down.
Give a Device ID (e.g. sensor-tile). Optionally you can add other fields like manufacturer or serial number etc.
Then provide a token (e.g. stm32sensortile).
After adding a device successfully you will get the Credentials to connect Watson IoT platform from your mobile phone through ST BlueMS app.
Plug the SensorTile core system to the Expansion Cradle and power it up.
SensorTile BlueMicrosystem2 firmware is installed by default. So, you don't need to install any firmware to the board.
Download and install ST BlueMS App from the Android store and scan for the SensorTile.
Click on the device form the Device list to connect with SensorTile.
After connecting successfully to the SensorTile you will find following look.
From the left menu select Cloud option and then choose IBM Watson IoT from the drop down. Put all the required credentials and tap to cloud icon.
After successfully connecting to the cloud you will find following view. Select all the sensor to upload all the sensor data to cloud.
You can also select a specific sensor only.
Now, lets add some Cards to our dashboard. To do so click on Add New Card button from top right corner.
Then, select a Cart type. I added Line chart to show how to prepare a line chart from Accelerometer data.
Select line chart and from the device list select your device. For my case it is sensor-tile.
Then select Accelerometer from the drown under new data set.
Than select X from the property field.
Select Number from the type field.
Click on Connect new data set.
Select Y from the name drop down and select Number from type drop down. Do the same fro Z.
You will get a preview and click next if you like default settings.
Your final card will look like following. You can add more Card as you like.
Now, we will create a rule to get an IFTTT notification for temperature. To do this first you have to create a Schema from the device tab.
Go to Manage Schemas and from the Properties tab click to Add property.
Select, automatic option and then select Temperature.
From the RULES tab click to Create Cloud Rule.
Add a new rule by entering the following information.
From the New condition set a condition.
Select Temperature from the property drop down.
Set a value to compare and select an operator.
Then, from the Action box edit the action. From the Type menu select IFTTT.
Enter the key from the IFTTT maker channel (webhook). Enter the Event and optionally you can put maximum 3 values if you like to see the value from the notification.
The final setup will look like follows.
Thank you.


Comments
Please log in or sign up to comment.